ConstantLine Properties
Constant line appearance and behavior
A constant line is a line that is graphed at a specified x-
or y-value in Cartesian axes. The xline and
yline functions create constant vertical and horizontal lines,
respectively. You can modify the appearance and behavior of the constant line by changing
ConstantLine property values.
xl = xline(4);
xl.LineWidth = 2;
Location
Labels
Line label, specified as a character vector, cell array of character vectors, string array, or numeric array. To create a multiline label, use a string array or a cell array of character vectors.
Example: "cutoff frequency"
Example: ["One row of text","A second row of text"]
Example: {'One row of text','A second row of text'}
To include special characters, such as superscripts, subscripts, Greek letters, or
mathematical symbols, use TeX markup. For a list of supported markup, see the Interpreter property.
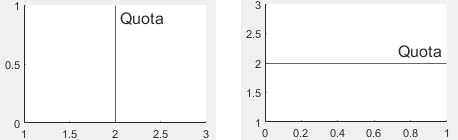
Horizontal alignment of the label with respect to the line, specified as one of the options in the table.
| Option | Description | |
|---|---|---|
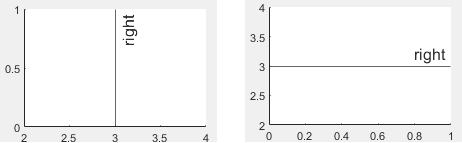
'right' | Right side of the line.
| |
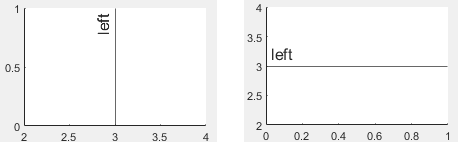
'left' | Left side of the line.
| |
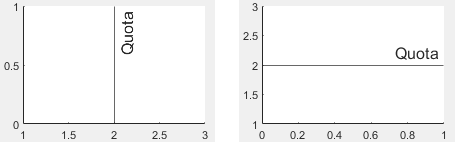
'center' | Center of the line. For vertical lines, the label segments the line.
| |

Vertical alignment of the label with respect to the line, specified as one of the options in the table.
| Option | Description | |
|---|---|---|
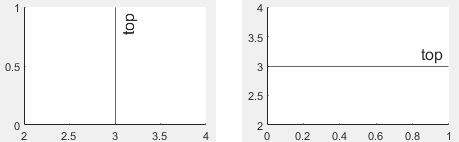
'top' | Top of the line.
| |
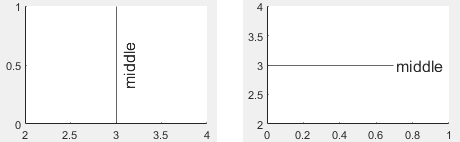
'middle' | Middle of the line. For horizontal lines, the label segments the line.
| |
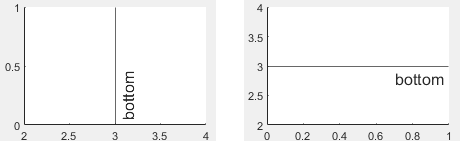
'bottom' | Bottom of the line.
| |
Label orientation, specified as 'aligned' or
'horizontal'. Examples are shown in the table.
| Orientation | Description | |
|---|---|---|
'aligned' | Label has the same orientation as the line.
| |
'horizontal' | Label is horizontal, regardless of the line orientation.
| |
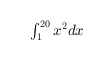
LaTeX Markup
To use LaTeX markup, set the interpreter to "latex". For inline
mode, surround the markup with single dollar signs ($). For
display mode, surround the markup with double dollar signs
($$).
| LaTeX Mode | Example | Result |
|---|---|---|
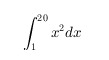
| Inline |
"$\int_1^{20} x^2 dx$" |
|
| Display |
"$$\int_1^{20} x^2 dx$$" |
|
The displayed text uses the default LaTeX font style. The
FontName, FontWeight, and
FontAngle properties do not have an effect. To change the
font style, use LaTeX markup.
The maximum size of the text that you can use with the LaTeX interpreter is 1200 characters. For multiline text, this reduces by about 10 characters per line.
MATLAB supports most standard LaTeX math mode commands. For more information, see Supported LaTeX Commands. For examples that use TeX and LaTeX, see Greek Letters and Special Characters in Chart Text.
Since R2024b
Label color, specified as an RGB triplet, a hexadecimal color code, a color name, or a short name.
For a custom color, specify an RGB triplet or a hexadecimal color code.
An RGB triplet is a three-element row vector whose elements specify the intensities of the red, green, and blue components of the color. The intensities must be in the range
[0,1], for example,[0.4 0.6 0.7].A hexadecimal color code is a string scalar or character vector that starts with a hash symbol (
#) followed by three or six hexadecimal digits, which can range from0toF. The values are not case sensitive. Therefore, the color codes"#FF8800","#ff8800","#F80", and"#f80"are equivalent.
Alternatively, you can specify some common colors by name. This table lists the named color options, the equivalent RGB triplets, and the hexadecimal color codes.
| Color Name | Short Name | RGB Triplet | Hexadecimal Color Code | Appearance |
|---|---|---|---|---|
"red" | "r" | [1 0 0] | "#FF0000" |
|
"green" | "g" | [0 1 0] | "#00FF00" |
|
"blue" | "b" | [0 0 1] | "#0000FF" |
|
"cyan"
| "c" | [0 1 1] | "#00FFFF" |
|
"magenta" | "m" | [1 0 1] | "#FF00FF" |
|
"yellow" | "y" | [1 1 0] | "#FFFF00" |
|
"black" | "k" | [0 0 0] | "#000000" |
|
"white" | "w" | [1 1 1] | "#FFFFFF" |
|
"none" | Not applicable | Not applicable | Not applicable | No color |
This table lists the default color palettes for plots in the light and dark themes.
| Palette | Palette Colors |
|---|---|
Before R2025a: Most plots use these colors by default. |
|
|
|
You can get the RGB triplets and hexadecimal color codes for these palettes using the orderedcolors and rgb2hex functions. For example, get the RGB triplets for the "gem" palette and convert them to hexadecimal color codes.
RGB = orderedcolors("gem");
H = rgb2hex(RGB);
Before R2023b: Get the RGB triplets using RGB =
get(groot,"FactoryAxesColorOrder").
Before R2024a: Get the hexadecimal color codes using H =
compose("#%02X%02X%02X",round(RGB*255)).
Since R2024b
Control how the LabelColor property is set, specified as one of
these values:
"auto"— MATLAB sets theLabelColorproperty to the same value as theColorproperty, so the line and the label have the same color."manual"— You set the value of theLabelColorproperty directly, and the color does not change.
If you change the value of the LabelColor property manually,
MATLAB changes the value of the LabelColorMode property to
"manual".
Color and Styling
Line color, specified as an RGB triplet, a hexadecimal color code, a color name, or a short name.
For a custom color, specify an RGB triplet or a hexadecimal color code.
An RGB triplet is a three-element row vector whose elements specify the intensities of the red, green, and blue components of the color. The intensities must be in the range
[0,1], for example,[0.4 0.6 0.7].A hexadecimal color code is a string scalar or character vector that starts with a hash symbol (
#) followed by three or six hexadecimal digits, which can range from0toF. The values are not case sensitive. Therefore, the color codes"#FF8800","#ff8800","#F80", and"#f80"are equivalent.
Alternatively, you can specify some common colors by name. This table lists the named color options, the equivalent RGB triplets, and the hexadecimal color codes.
| Color Name | Short Name | RGB Triplet | Hexadecimal Color Code | Appearance |
|---|---|---|---|---|
"red" | "r" | [1 0 0] | "#FF0000" |
|
"green" | "g" | [0 1 0] | "#00FF00" |
|
"blue" | "b" | [0 0 1] | "#0000FF" |
|
"cyan"
| "c" | [0 1 1] | "#00FFFF" |
|
"magenta" | "m" | [1 0 1] | "#FF00FF" |
|
"yellow" | "y" | [1 1 0] | "#FFFF00" |
|
"black" | "k" | [0 0 0] | "#000000" |
|
"white" | "w" | [1 1 1] | "#FFFFFF" |
|
"none" | Not applicable | Not applicable | Not applicable | No color |
This table lists the default color palettes for plots in the light and dark themes.
| Palette | Palette Colors |
|---|---|
Before R2025a: Most plots use these colors by default. |
|
|
|
You can get the RGB triplets and hexadecimal color codes for these palettes using the orderedcolors and rgb2hex functions. For example, get the RGB triplets for the "gem" palette and convert them to hexadecimal color codes.
RGB = orderedcolors("gem");
H = rgb2hex(RGB);
Before R2023b: Get the RGB triplets using RGB =
get(groot,"FactoryAxesColorOrder").
Before R2024a: Get the hexadecimal color codes using H =
compose("#%02X%02X%02X",round(RGB*255)).
Example: 'g'
Example: [0.6 0.2 0.5]
Example: '#D2F9A7'
Line style, specified as one of the options listed in this table.
| Line Style | Description | Resulting Line |
|---|---|---|
"-" | Solid line |
|
"--" | Dashed line |
|
":" | Dotted line |
|
"-." | Dash-dotted line |
|
"none" | No line | No line |
Line width, specified as a positive value in points.
Line transparency, specified as a scalar in the range [0,1]. A value of 1 is opaque and 0 is completely transparent. Values between 0 and 1 are semitransparent.
Series index, specified as a positive whole number or "none".
This property is useful for reassigning the colors and line styles of
ConstantLine objects so that they match other objects.
When the SeriesIndex property is a number, MATLAB uses the number to calculate indices for assigning colors and line styles
when you call the xline or yline functions.
The indices refer to the rows of the arrays stored in the
ColorOrder and LineStyleOrder properties of
the axes. Any objects in the axes that have the same SeriesIndex
number will have the same color (and line style, if applicable).
A SeriesIndex value of "none" corresponds to a
solid line with a neutral color that does not participate in the indexing scheme.
How Manually Setting Colors, Line Styles, or Markers Overrides SeriesIndex Behavior
To manually control the color and line style, set the Color
and LineStyle properties of the ConstantLine
object.
When you manually set these properties of an object, MATLAB disables automatic color and line style selection for that object and
allows your selection to persist, regardless of the value of the
SeriesIndex property. The ColorMode and
LineStyleMode properties indicate whether the colors and line
styles have been set manually (by you) or automatically. For each of these mode
properties, a value of "manual" indicates manual selection, and
"auto" indicates automatic selection.
To enable automatic selection again, set the ColorMode,
LineStyleMode, or both properties to "auto",
and set the SeriesIndex property to a positive whole
number.
In some cases, MATLAB sets the SeriesIndex property to
0, which also disables automatic color selection.