kfoldLoss
Loss for cross-validated partitioned regression model
Description
L = kfoldLoss(CVMdl,Name,Value)
Examples
Find the cross-validation loss for a regression ensemble of the carsmall data.
Load the carsmall data set and select displacement, horsepower, and vehicle weight as predictors.
load carsmall
X = [Displacement Horsepower Weight];
Train an ensemble of regression trees.
rens = fitrensemble(X,MPG);
Create a cross-validated ensemble from rens and find the k-fold cross-validation loss.
rng(10,'twister') % For reproducibility
cvrens = crossval(rens);
L = kfoldLoss(cvrens)
L =
28.7114
The mean squared error (MSE) is a measure of model quality. Examine the MSE for each fold of a cross-validated regression model.
Load the carsmall data set. Specify the predictor X and the response data Y.
load carsmall
X = [Cylinders Displacement Horsepower Weight];
Y = MPG;
Train a cross-validated regression tree model. By default, the software implements 10-fold cross-validation.
rng('default') % For reproducibility
CVMdl = fitrtree(X,Y,'CrossVal','on');
Compute the MSE for each fold. Visualize the distribution of the loss values by using a box plot. Notice that none of the values is an outlier.
losses = kfoldLoss(CVMdl,'Mode','individual')
losses = 10×1

   42.5072
   20.3995
   22.3737
   34.4255
   40.8005
   60.2755
   19.5562
    9.2060
   29.0788
   16.3386
boxchart(losses)

Compute the loss and the predictions for a classification model, first partitioned using holdout validation and then partitioned using 3-fold cross-validation. Compare the two sets of losses and predictions.
Create a table from the fisheriris data set, which contains length and width measurements from the sepals and petals of three species of iris flowers. View the first eight observations.
fisheriris = readtable("fisheriris.csv");
head(fisheriris)
SepalLength SepalWidth PetalLength PetalWidth Species
___________ __________ ___________ __________ __________
5.1 3.5 1.4 0.2 {'setosa'}
4.9 3 1.4 0.2 {'setosa'}
4.7 3.2 1.3 0.2 {'setosa'}
4.6 3.1 1.5 0.2 {'setosa'}
5 3.6 1.4 0.2 {'setosa'}
5.4 3.9 1.7 0.4 {'setosa'}
4.6 3.4 1.4 0.3 {'setosa'}
5 3.4 1.5 0.2 {'setosa'}
Partition the data using cvpartition. First, create a partition for holdout validation, using approximately 70% of the observations for the training data and 30% for the validation data. Then, create a partition for 3-fold cross-validation.
rng(0,"twister") % For reproducibility
holdoutPartition = cvpartition(fisheriris.Species,Holdout=0.30);
kfoldPartition = cvpartition(fisheriris.Species,KFold=3);
holdoutPartition and kfoldPartition are both stratified random partitions. You can use the training and test functions to find the indices for the observations in the training and validation sets, respectively.
Train a classification tree model using the fisheriris data. Specify Species as the response variable.
Mdl = fitctree(fisheriris,"Species");Create the partitioned classification models using crossval.
holdoutMdl = crossval(Mdl,CVPartition=holdoutPartition)
holdoutMdl =
  ClassificationPartitionedModel
    CrossValidatedModel: 'Tree'
         PredictorNames: {'SepalLength'  'SepalWidth'  'PetalLength'  'PetalWidth'}
           ResponseName: 'Species'
        NumObservations: 150
                  KFold: 1
              Partition: [1×1 cvpartition]
             ClassNames: {'setosa'  'versicolor'  'virginica'}
         ScoreTransform: 'none'


  Properties, Methods
kfoldMdl = crossval(Mdl,CVPartition=kfoldPartition)
kfoldMdl =
  ClassificationPartitionedModel
    CrossValidatedModel: 'Tree'
         PredictorNames: {'SepalLength'  'SepalWidth'  'PetalLength'  'PetalWidth'}
           ResponseName: 'Species'
        NumObservations: 150
                  KFold: 3
              Partition: [1×1 cvpartition]
             ClassNames: {'setosa'  'versicolor'  'virginica'}
         ScoreTransform: 'none'


  Properties, Methods
holdoutMdl and kfoldMdl are ClassificationPartitionedModel objects.
Compute the minimal expected misclassification cost for holdoutMdl and kfoldMdl using kfoldLoss. Because both models use the default cost matrix, this cost is the same as the classification error.
holdoutL = kfoldLoss(holdoutMdl)
holdoutL =
0.0889
kfoldL = kfoldLoss(kfoldMdl)
kfoldL =
0.0600
holdoutL is the error computed using the predictions for one validation set, while kfoldL is an average error computed using the predictions for three folds of validation data. Cross-validation metrics tend to be better indicators of a model's performance on unseen data.
Compute the validation data predictions for the two models using kfoldPredict.
[holdoutLabels,holdoutScores] = kfoldPredict(holdoutMdl);
[kfoldLabels,kfoldScores] = kfoldPredict(kfoldMdl);

holdoutClassNames = holdoutMdl.ClassNames;
holdoutScores = array2table(holdoutScores,VariableNames=holdoutClassNames);
kfoldClassNames = kfoldMdl.ClassNames;
kfoldScores = array2table(kfoldScores,VariableNames=kfoldClassNames);

predictions = table(holdoutLabels,kfoldLabels, ...
    holdoutScores,kfoldScores, ...
    VariableNames=["holdoutMdl Labels","kfoldMdl Labels", ...
    "holdoutMdl Scores","kfoldMdl Scores"])
predictions=150×4 table
    holdoutMdl Labels    kfoldMdl Labels            holdoutMdl Scores                     kfoldMdl Scores
    _________________    _______________    _________________________________    _________________________________

                                            setosa    versicolor    virginica    setosa    versicolor    virginica
                                            ______    __________    _________    ______    __________    _________

       {'setosa'}          {'setosa'}        NaN         NaN           NaN         1           0             0
       {'setosa'}          {'setosa'}          1           0             0         1           0             0
       {'setosa'}          {'setosa'}        NaN         NaN           NaN         1           0             0
       {'setosa'}          {'setosa'}        NaN         NaN           NaN         1           0             0
       {'setosa'}          {'setosa'}        NaN         NaN           NaN         1           0             0
       {'setosa'}          {'setosa'}        NaN         NaN           NaN         1           0             0
       {'setosa'}          {'setosa'}        NaN         NaN           NaN         1           0             0
       {'setosa'}          {'setosa'}        NaN         NaN           NaN         1           0             0
       {'setosa'}          {'setosa'}        NaN         NaN           NaN         1           0             0
       {'setosa'}          {'setosa'}        NaN         NaN           NaN         1           0             0
       {'setosa'}          {'setosa'}          1           0             0         1           0             0
       {'setosa'}          {'setosa'}        NaN         NaN           NaN         1           0             0
       {'setosa'}          {'setosa'}        NaN         NaN           NaN         1           0             0
       {'setosa'}          {'setosa'}          1           0             0         1           0             0
       {'setosa'}          {'setosa'}          1           0             0         1           0             0
       {'setosa'}          {'setosa'}        NaN         NaN           NaN         1           0             0
      ⋮
kfoldPredict returns NaN scores for the observations used to train holdoutMdl.Trained. For these observations, the function selects the class label with the highest frequency as the predicted label. In this case, because all classes have the same frequency, the function selects the first class (setosa) as the predicted label. The function uses the trained model to return predictions for the validation set observations. kfoldPredict returns each kfoldMdl prediction using the model in kfoldMdl.Trained that was trained without that observation.
To predict responses for unseen data, use the model trained on the entire data set (Mdl) and its predict function rather than a partitioned model such as holdoutMdl or kfoldMdl.
Train a cross-validated generalized additive model (GAM) with 10 folds. Then, use kfoldLoss to compute the cumulative cross-validation regression loss (mean squared errors). Use the errors to determine the optimal number of trees per predictor (linear term for predictor) and the optimal number of trees per interaction term.
Alternatively, you can find optimal values of fitrgam name-value arguments by using the OptimizeHyperparameters name-value argument. For an example, see Optimize GAM Using OptimizeHyperparameters.
Load the patients data set.
load patientsCreate a table that contains the predictor variables (Age, Diastolic, Smoker, Weight, Gender, and SelfAssessedHealthStatus) and the response variable (Systolic).
tbl = table(Age,Diastolic,Smoker,Weight,Gender,SelfAssessedHealthStatus,Systolic);
Create a cross-validated GAM by using the default cross-validation option. Specify the 'CrossVal' name-value argument as 'on'. Also, specify to include 5 interaction terms.
rng('default') % For reproducibility
CVMdl = fitrgam(tbl,'Systolic','CrossVal','on','Interactions',5);
If you specify 'Mode' as 'cumulative' for kfoldLoss, then the function returns cumulative errors, which are the average errors across all folds obtained using the same number of trees for each fold. Display the number of trees for each fold.
CVMdl.NumTrainedPerFold
ans = struct with fields:
      PredictorTrees: [300 300 300 300 300 300 300 300 300 300]
    InteractionTrees: [76 100 100 100 100 42 100 100 59 100]
kfoldLoss can compute cumulative errors using up to 300 predictor trees and 42 interaction trees.
Plot the cumulative, 10-fold cross-validated, mean squared errors. Specify 'IncludeInteractions' as false to exclude interaction terms from the computation.
L_noInteractions = kfoldLoss(CVMdl,'Mode','cumulative','IncludeInteractions',false);
figure
plot(0:min(CVMdl.NumTrainedPerFold.PredictorTrees),L_noInteractions)
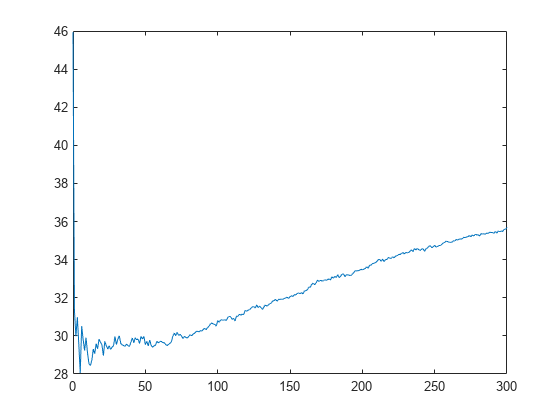
The first element of L_noInteractions is the average error over all folds obtained using only the intercept (constant) term. The (J+1)th element of L_noInteractions is the average error obtained using the intercept term and the first J predictor trees per linear term. Plotting the cumulative loss allows you to monitor how the error changes as the number of predictor trees in the GAM increases.
Find the minimum error and the number of predictor trees used to achieve the minimum error.
[M,I] = min(L_noInteractions)
M =
28.0506
I =
6
The GAM achieves the minimum error when it includes 5 predictor trees.
Compute the cumulative mean squared error using both linear terms and interaction terms.
L = kfoldLoss(CVMdl,'Mode','cumulative');
figure
plot(0:min(CVMdl.NumTrainedPerFold.InteractionTrees),L)
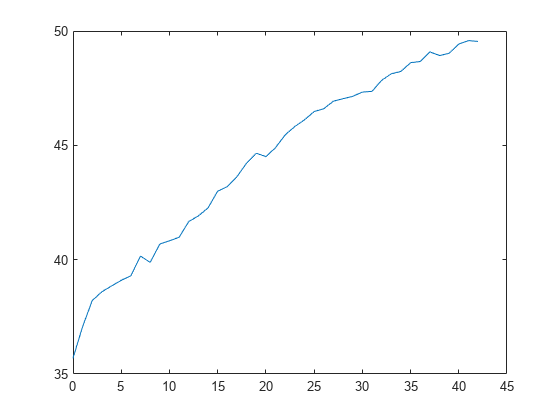
The first element of L is the average error over all folds obtained using the intercept (constant) term and all predictor trees per linear term. The (J+1)th element of L is the average error obtained using the intercept term, all predictor trees per linear term, and the first J interaction trees per interaction term. The plot shows that the error increases when interaction terms are added.
If you are satisfied with the error when the number of predictor trees is 5, you can create a predictive model by training the univariate GAM again and specifying 'NumTreesPerPredictor',5 without cross-validation.
Input Arguments
Name-Value Arguments
Output Arguments
Alternative Functionality
If you want to compute the cross-validated loss of a tree model, you can avoid
constructing a RegressionPartitionedModel object by calling cvloss. Creating a cross-validated tree object can save you time if you plan to
examine it more than once.