テーブルの書式設定
レポートにテーブルを作成するには、mlreportgen.dom.Table、mlreportgen.dom.FormalTable、mlreportgen.dom.MATLABTable、または mlreportgen.report.BaseTable オブジェクトを使用できます。Report Generator で作成するテーブルの種類の選択を参照してください。次の方法を使用して、これらのタイプのテーブルまたはテーブルの要素 (セクション、行、列グループ、またはエントリ) を書式設定できます。
テーブルを作成する前にコンテンツを書式設定する。たとえば、数値を使用してテーブルを作成する前に、MATLAB® で数値を書式設定します。テーブル内の数値の書式設定を参照してください。
DOM オブジェクトからテーブルを作成する前に、DOM オブジェクトを書式設定する。たとえば、テーブル エントリの作成に使用する前に、
mlreportgen.dom.Paragraphオブジェクトを書式設定します。既定のテンプレート スタイルを変更するか、テーブルまたはテーブル要素のカスタム テンプレート スタイルを作成する。テンプレート定義スタイルを使用したテーブルの書式設定を参照してください。
テーブルまたはテーブル要素を表すオブジェクトと共に書式プロパティと書式オブジェクトを使用して、テンプレート スタイルをオーバーライドする。プログラムによるテーブルの書式設定を参照してください。
MATLABTable テーブルの書式設定に固有の情報については、MATLAB table からのテーブルの作成を参照してください。BaseTable テーブルの書式設定に固有の情報については、Create Report API Base Tablesを参照してください。
テーブル オブジェクト、テーブル要素オブジェクト、またはテーブル要素オブジェクトに含まれるオブジェクトの場合、書式プロパティまたは書式オブジェクトによって指定された書式は、テンプレートベースのスタイルによって指定された同等の書式をオーバーライドします。オブジェクトに指定された書式は、コンテナー オブジェクトによって指定された同等の書式をオーバーライドします。たとえば、テーブル エントリに mlreportgen.dom.Paragraph オブジェクトが含まれている場合、Paragraph オブジェクトに指定されたテキストの色は、それを含む行に指定された色をオーバーライドします。行の色は、その行を含むテーブルに指定された色をオーバーライドします。書式の継承を参照してください。
テンプレート定義スタイルを使用したテーブルの書式設定
テーブルとテーブルの要素には、既定のテンプレート定義スタイルがあります。Microsoft® Word でのスタイルの操作や HTML または PDF レポートのカスケード スタイル シート (CSS) の編集に慣れており、カスタマイズを複数のテーブルに適用するような場合には、テンプレート定義スタイルをカスタマイズすることを検討してください。
Word のテーブル スタイルの作成
テーブルにカスタム Microsoft Word スタイルを適用することで、テーブルを書式設定できます。テーブル スタイルを Word の形式的テーブルの 1 つ以上のセクションに適用する場合は、テーブルの各列の幅を指定します。そうしない場合、セクションの列が整列しないことがあります。
Word スタイル シートでテーブル スタイルを定義するには、次のようにします。
Microsoft Word テンプレートを作成します。Microsoft Word テンプレートの作成の詳細については、Microsoft Word テンプレートの作成を参照してください。
次のいずれかの方法で、Word テンプレート ファイルを開きます。
MATLAB の [現在のフォルダー] ペインでテンプレート ファイルを右クリックし、[MATLAB の外部で開く] をクリックします。
MATLAB の外でファイルを右クリックし、[開く] をクリックします。
メモ
Word テンプレート ファイルをダブル クリックで開かないようにしてください。ファイルをダブル クリックすると、テンプレートを適用した Word ドキュメント ファイルが開きます。
Word の [ホーム] タブの [スタイル] グループで、[スタイル] アイコン
 をクリックします。
[スタイルの管理] ボタン
 をクリックします。
[新しいスタイル] をクリックします。
[書式から新しいスタイルを作成] ダイアログ ボックスで、次のようにします。
[名前] を指定。
[種類] を
[表]に設定。[基準にするスタイル] で、新しいスタイルの基準となるスタイルを選択。
[書式] セクションで、適用する書式およびテーブルのどの部分にその書式を適用するかを指定。
[このテンプレートを使用した新規文書] を選択し、[OK] をクリックします。
[スタイルの管理] ダイアログ ボックスで、[このテンプレートを使用した新規文書] を選択し、[OK] をクリックします。
テンプレートを保存します。
Word テンプレートを使用した書式設定の例については、Create a Zebra-Striped Tableを参照してください。
HTML または PDF のテーブル スタイルの作成
テンプレートで定義された CSS スタイルを使用して、HTML および PDF テーブルを書式設定できます。HTML または PDF テンプレートの作成については、HTML および PDF のテンプレートの作成を参照してください。
HTML または PDF テンプレートでテーブル スタイルを定義するには、table セレクターとクラス名を使用します。たとえば、次の CSS コードはクラス MyTable のテーブルのスタイルを指定します。
table.MyTable {
  border-style: solid;
  border-bottom-color: rgb(128, 128, 128);
  border-bottom-width: thin;
  border-collapse: collapse;
}
CSS 子孫セレクター (スペース) または子セレクター (>) を使用して、テーブルの子孫または子の書式を指定できます。たとえば、次の CSS コードは、スタイルが MyTable であるテーブルのテーブル エントリ (td 要素) の書式を指定します。
table.MyTable td {
      font-family: Arial, Helvetica, sans-serif;
      font-size: 11pt;
      text-align: center;
   }
HTML テンプレートでのスタイルの変更とPDF テンプレートでのスタイルの変更を参照してください。
CSS の編集の詳細については、https://developer.mozilla.org/en-US/docs/Web/CSS/Referenceなどのドキュメンテーションを参照してください。
HTML テンプレートを使用した書式設定の例については、Create a Zebra-Striped Tableを参照してください。
テーブルまたはテーブル要素へのスタイルの適用
テンプレートでスタイルを定義したら、レポート プログラムのテーブルまたはテーブル要素を表すオブジェクトにスタイルを適用できます。スタイルを引数としてオブジェクト コンストラクターに渡すか、オブジェクトの StyleName プロパティにスタイルを割り当てます。mlreportgen.dom.TableHeader オブジェクト、mlreportgen.dom.TableBody オブジェクト、または mlreportgen.dom.TableEntry オブジェクトの StyleName プロパティにスタイルを割り当てることで、mlreportgen.dom.FormalTable または mlreportgen.dom.MATLABTable オブジェクトのヘッダー、本文、またはフッター セクションにそのスタイルを適用できます。
たとえば、レポートのテンプレートで BodyPara、TableTitle、および RuledTable という名前のスタイルを定義したとします。次の例では、Paragraph コンストラクター、Paragraph オブジェクトの StyleName プロパティ、および Table コンストラクターでスタイル名を指定しています。
import mlreportgen.dom.*;
rank = 5;
rpt = Document("MyReport","html","MyTemplate");

p = Paragraph("Here is a magic square or rank 5:","BodyPara");
append(rpt,p);

p = Paragraph(sprintf("Rank %d MagicSquare",rank));
p.StyleName = "TableTitle";

append(rpt,Table(magic(rank),"RuledTable"));

close(rpt);
rptview(rpt.OutputPath);
プログラムによる書式設定を使用して、テンプレートベースのテーブル スタイルで定義されたスタイルをオーバーライドできます。たとえば、テンプレートで UnruledTable という名前のテーブル スタイルを定義して、罫線や列または行の区切りのないテーブルを作成するとします。次に、レポート プログラムでスタイルをオーバーライドして、テーブルの周りに枠を描画できます。
import mlreportgen.dom.*;
rpt = Document("MyReport","html","MyTemplate");

table = Table(magic(5),"UnruledTable");
table.Border = "single";
append(rpt,table);

close(rpt);
rptview(rpt.OutputPath);
プログラムによる書式設定の詳細については、プログラムによるテーブルの書式設定を参照してください。
スタイル シートを使用したテーブル エントリの書式設定
HTML および PDF レポートの場合、HTML テンプレート スタイル シートで定義されたスタイルを使用して、テーブル エントリを書式設定できます。テーブル エントリのスタイルを定義するときは、td 要素セレクターを使用します。以下に例を示します。
td.TableEntryWithBorder {
  border:5px solid red;
}
テンプレート定義のスタイルをテーブル エントリに適用するには、TableEntry オブジェクトの StyleName プロパティをそのスタイルの名前に設定するか、スタイル名を TableEntry コンストラクターの 2 番目の引数として指定します。以下に例を示します。
te = TableEntry("Hello World","TableEntryWithBorder");
プログラムによるテーブルの書式設定
CSS の編集に慣れていない場合、またはテーブルやテーブル要素が少ししかない既定のテーブル スタイルをオーバーライドしたい場合には、テーブルおよびテーブル要素をプログラムで書式設定できます。次のいずれかの方法を使用します。
テーブルまたはテーブル要素を表すオブジェクトの書式プロパティを設定する。
テーブルまたはテーブル要素を表すオブジェクトの
Styleプロパティに書式オブジェクトを追加する。新しい書式オブジェクトを含む cell 配列とStyleプロパティの既存の値を連結して、書式オブジェクトを追加します。以下に例を示します。table.Style = [table.Style {Border("solid","black","3px")}];
mlreportgen.dom.Table オブジェクト、mlreportgen.dom.FormalTable オブジェクト、および mlreportgen.dom.MATLABTable オブジェクトに適用される書式オブジェクトおよび対応する書式プロパティの一部を次に示します。
| 書式設定 | 書式オブジェクト | 書式プロパティ |
|---|---|---|
テーブルの幅 |
| |
テーブルの背景色 |
| |
テーブルの境界線を指定 |
| |
境界線の色 |
| |
境界線の太さ |
| |
テーブルの上下左右の境界線を指定 | N/A | |
テーブルとテーブル エントリの境界線を折りたたむ (HTML レポートのみ) |
| |
列区切りを指定 |
| |
列区切りの色 |
| |
列区切りの太さ |
| |
行区切りを指定 |
| |
行区切りの色 |
| |
行区切りの太さ |
| |
左余白からテーブルをインデント |
| |
テーブルの前後の空白 | N/A | |
テーブルの右側の空白 | N/A | |
テーブルを左、右、または中央揃えにする |
| |
テーブル エントリの配置方向を指定 (左から右または右から左) |
| |
コンテンツに合わせてテーブル列をサイズ変更 | N/A |
テーブルに含まれるオブジェクトに適用される他の書式オブジェクトを使用できます。DOM API は、特定のオブジェクトに適用されない書式オブジェクトを無視します。
プログラムによる略式テーブルの書式設定
テーブル全体に適用される書式設定の場合は、テーブル全体を表すオブジェクトと共に書式プロパティと書式オブジェクトを使用します。この例では、書式オブジェクトを使用して、テーブルの境界線および行と列の区切りを指定します。書式プロパティを使用して背景色を指定します。

import mlreportgen.dom.*
d = Document("test","html");

table = Table(magic(5));
table.Style = [table.Style {Border("inset","red","3px"), ...
               ColSep("single","black","1px"), ...
               RowSep("single","black","1px")}];

table.BackgroundColor = "lightsteelblue";

append(d, table);

close(d);
rptview(d.OutputPath);
プログラムによる形式的テーブルまたは MATLAB テーブルの書式設定
書式プロパティと書式オブジェクトを使用して、mlreportgen.dom.FormalTable および mlreportgen.dom.MATLABTable オブジェクトを書式設定できます。テーブルとそのセクションの 1 つに書式を指定すると、セクションに指定した値がテーブル全体の値をオーバーライドします。形式的テーブルのすべての書式が形式的テーブルのセクションに適用されるわけではありません。たとえば、OuterLeftMargin プロパティは形式的テーブルのセクションに適用されません。ヘッダー、本体、またはフッターのセクションは、それを含むテーブルと別個にインデントできません。
テーブル エントリの書式設定
書式設定のためにテーブル エントリにアクセスするには、mlreportgen.dom.Table オブジェクト、mlreportgen.dom.TableHeader オブジェクト、mlreportgen.dom.TableBody オブジェクト、または mlreportgen.dom.TableFooter オブジェクトの entry メソッドを使用できます。
entry メソッドは、mlreportgen.dom.TableEntry オブジェクトまたは mlreportgen.dom.TableHeaderEntry オブジェクトを返します。エントリを書式設定するには、以下の TableEntry 書式プロパティまたは書式オブジェクトを使用できます。
| 書式設定 | 書式オブジェクト | 書式プロパティ |
|---|---|---|
エントリの周囲に境界線を作成 |
| |
境界線の色 |
| |
境界線の太さ |
| |
エントリの上下左右の境界線を作成 | N/A | |
エントリのコンテンツを上、下、または中央揃えにする |
| |
エントリ境界とエントリ コンテンツの間の空白 |
| |
エントリ コンテンツとその上下左右の境界との間の空白 | N/A | |
エントリが複数の列にまたがるようにする |
|
|
エントリが複数の行にまたがるようにする |
|
|
テーブル エントリに含まれるオブジェクトに適用される他の書式オブジェクトを使用できます。DOM API は、特定のオブジェクトに適用されない書式オブジェクトを無視します。
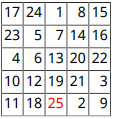
この例では、関数 magic の出力からテーブルを作成し、テーブルの最も大きい数値を赤にします。

import mlreportgen.dom.*;

d = Document("test","pdf");

m = magic(5);
[v,i] = max(m);
[v1,i1] = max(max(m));
t = Table(m);
t.Border = "single";
t.ColSep = "single";
t.RowSep = "single";

t.TableEntriesInnerMargin = "2pt";
t.TableEntriesHAlign = "right";

maxnum = entry(t,i(i1),i1);
maxnum.Children(1).Color = "Red";

append(d,t);

close(d);
rptview(d);
すべてのテーブル エントリの書式設定
DOM テーブルまたは DOM テーブルのセクションのすべてのエントリに同じ書式または書式セットを指定するには、次のプロパティを使用できます。
TableEntriesValignTableEntriesHalignTableEntriesInnerMarginTableEntriesStyle
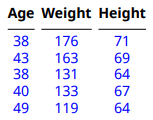
この例では、MATLAB table からテーブルを作成します。例では、次を行います。
TableEntriesStyleプロパティに書式オブジェクトを追加して、テーブル本体のすべてのエントリを青にするすべての
TableEntriesHalignプロパティを設定して、テーブル本体のすべてのエントリを中央揃えにする

import mlreportgen.dom.*
d = Document("outermargin","docx");

import mlreportgen.dom.*
d = Document("myMATLABTable","pdf");

Age = [38;43;38;40;49];
Height = [71;69;64;67;64];
Weight = [176;163;131;133;119];
mltable = table(Age,Weight,Height);

mltableObj = MATLABTable(mltable);
tbodyObj = mltableObj.Body;
tbodyObj.TableEntriesStyle = {Color("blue")};
tbODYObj.TableEntriesHAlign = "center";

append(d,mltableObj);

close(d);
rptview(d);
テーブルの行の書式設定
書式設定のためにテーブルの行にアクセスするには、mlreportgen.dom.Table オブジェクト、mlreportgen.dom.TableHeader オブジェクト、mlreportgen.dom.TableBody オブジェクト、または mlreportgen.dom.TableFooter オブジェクトの row メソッドを使用できます。
row メソッドは、mlreportgen.dom.TableRow オブジェクトを返します。行を書式設定するには、以下の TableRow 書式プロパティまたは書式オブジェクトを使用できます。
| 書式設定 | 書式オブジェクト | 書式プロパティ |
|---|---|---|
行の正確な高さを指定 |
| |
行の最小の高さを指定 (Word レポートのみ) | N/A | |
テーブルがページをまたぐ際、この行がヘッダー行として繰り返されるようにする | mlreportgen.dom.RepeatAsHeaderRow | N/A |
この行がページ境界をまたぐことを許可 | mlreportgen.dom.AllowBreakAcrossPages | N/A |
行に含まれるオブジェクトに適用される他の書式オブジェクトを使用できます。DOM API は、特定のオブジェクトに適用されない書式オブジェクトを無視します。
この例では、関数 magic の出力からテーブルを作成し、最初の行のコンテンツを赤にします。

import mlreportgen.dom.*;

d = Document("test","pdf");

m = magic(5);
[v,i] = max(m);
[v1,i1] = max(max(m));
t = Table(m);
t.Border = "single";
t.ColSep = "single";
t.RowSep = "single";

t.TableEntriesInnerMargin = "2pt";
t.TableEntriesHAlign = "right";

r = row(t,1);
r.Style = [r.Style {Color("red")}];
append(d,t);
close(d);
rptview(d);
テーブルの列の書式設定
隣接するテーブル列のグループの書式を指定するには、mlreportgen.dom.TableColSpecGroup オブジェクトを使用します。一部の列の列グループの書式をオーバーライドするには、mlreportgen.dom.TableColSpec オブジェクトを使用します。
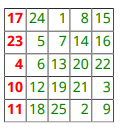
次の例では、TableColSpecGroup オブジェクトが緑のテキストを指定しています。TableColSpec オブジェクトは、最初の列の書式をオーバーライドし、赤の太字テキストを指定します。

import mlreportgen.dom.*
rpt = Document("test","pdf");

rank = 5;
t = Table(magic(rank));
t.Border = "single";
t.ColSep = "single";
t.RowSep = "single";
t.TableEntriesInnerMargin = "2pt";
t.TableEntriesHAlign = "right";

%Specify the formats for all columns
grps(1) = TableColSpecGroup;
grps(1).Span = rank;
grps(1).Style = {Color("green")};

%Specify the formats for the first column
specs(1) = TableColSpec;
specs(1).Span = 1;
specs(1).Style = {Bold(true),Color("red")};

grps(1).ColSpecs = specs;

t.ColSpecGroups = grps;
append(rpt,t);

close(rpt);
rptview(rpt.OutputPath);
列内のテーブル エントリのうち最も幅の広いコンテンツに合わせて列のサイズを変更するには、テーブルの Style プロパティに ResizeToFitContents オブジェクトを含めます。
参考
mlreportgen.dom.Table | mlreportgen.dom.TableRow | mlreportgen.dom.TableEntry | mlreportgen.dom.FormalTable | mlreportgen.dom.MATLABTable | mlreportgen.report.BaseTable | mlreportgen.dom.TableHeaderEntry | mlreportgen.dom.TableColSpecGroup | mlreportgen.dom.TableColSpec