振幅変調の例
以下の例では、振幅変調 (AM) の手法を示します。
QAM コンスタレーション形状の変調次数依存性
さまざまな M-QAM コンスタレーションをプロットして、形状が変調次数によって異なることを示します。
シンボルあたりのビット数 から、変調次数 の値のベクトルを定義します。
k = 1:7;  % Number of bits per symbol
M = 2.^k; % Modulation order
forループを使用して、変調スキームのシンボルの完全なセットを含むデータ シーケンスを作成し、そのデータを変調して、ベクトル k の値の範囲内で各変調次数のコンスタレーションをプロットします。シンボルあたりのビット数 によってコンスタレーションの形状が異なることに注意してください。
の値が偶数である場合、コンスタレーションは正方形になる。
の値が奇数である場合、コンスタレーションは十字になる。
および の場合、コンスタレーションは四角形になる。
for ii = 1:length(M)
    disp(['k = ',num2str(k(ii))])
    d = 0:M(ii)-1;
    y = qammod(d,M(ii),PlotConstellation=true);

end
k = 1

k = 2

k = 3

k = 4

k = 5

k = 6

k = 7

シンボル エラー レートの計算
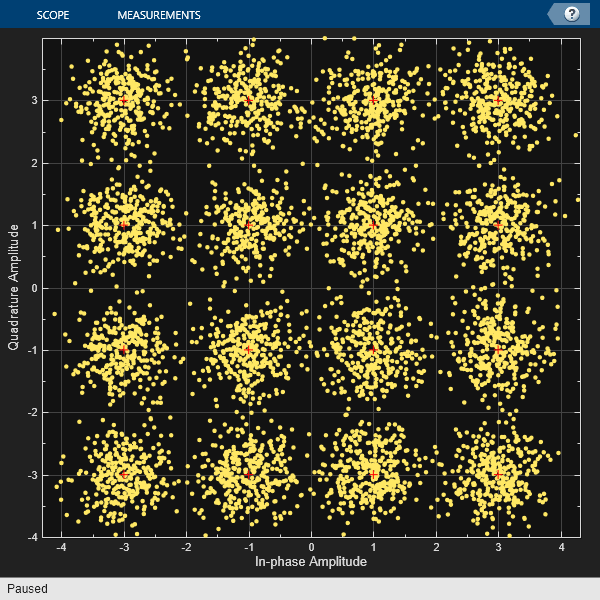
この例では、ランダムなデジタル信号を生成して変調し、ノイズを付加し、ノイズを含む信号を復調し、そのシンボル エラー レートを計算します。次に、ノイズを含む変調データをコンスタレーション ダイアグラムにプロットします。ランダムな入力データによって、数値結果とプロットが異なる場合があります。
ランダムなデジタル メッセージとコンスタレーション ダイアグラム System object™ を作成します。
M = 16; % Alphabet size, 16-QAM
x = randi([0 M-1],5000,1);

cdpts = qammod(0:M-1,M);
constDiag = comm.ConstellationDiagram( ...
    ReferenceConstellation=cdpts, ...
    AxesLimits=[-4 4]);
16-QAM 変調を適用し、AWGN チャネルを通して信号を送信します。
y = qammod(x,M);
ynoisy = awgn(y,15,'measured');
ノイズを含むデータ ynoisy を復調してメッセージを復元し、シンボル エラー レートをチェックします。
z = qamdemod(ynoisy,M);
[num,errrate] = symerr(x,z)
num =
73
errrate =
0.0146
ノイズを含むデータをコンスタレーション ダイアグラムにプロットします。信号の基準コンスタレーションには 16 個の正確な位置の点がありますが、送信信号にノイズが付加されているため、散布図では各基準コンスタレーション点の周囲に点の小さなクラスターが散らばっています。
constDiag(ynoisy)
参考
関数
modnorm|rcosdesign|genqammod|genqamdemod|pammod|pamdemod|qammod|qamdemod
オブジェクト
comm.RaisedCosineTransmitFilter|comm.RaisedCosineReceiveFilter|comm.GeneralQAMModulator|comm.GeneralQAMDemodulator
ブロック
- Raised Cosine Transmit Filter | Raised Cosine Receive Filter | General QAM Modulator Baseband | General QAM Demodulator Baseband | M-PAM Modulator Baseband | M-PAM Demodulator Baseband | Rectangular QAM Modulator Baseband | Rectangular QAM Demodulator Baseband