EmpiricalDistribution
Description
An EmpiricalDistribution probability distribution object
contains the distribution name, object parameters, and input data for a nonparametric
empirical distribution.
The empirical distribution is a nonparametric estimation of the cumulative distribution function (cdf) of a set of data.
Creation
Create an EmpiricalDistribution probability distribution object by
fitting a distribution to data using fitdist.
Properties
Object Functions
cdf | Cumulative distribution function |
gather | Gather properties of Statistics and Machine Learning Toolbox object from GPU |
icdf | Inverse cumulative distribution function |
iqr | Interquartile range of probability distribution |
mean | Mean of probability distribution |
median | Median of probability distribution |
negloglik | Negative loglikelihood of probability distribution |
pdf | Probability density function |
plot | Plot probability distribution object |
random | Random numbers |
std | Standard deviation of probability distribution |
truncate | Truncate probability distribution object |
var | Variance of probability distribution |
Examples
Generate random data from a standard normal distribution. Visualize the data x using a histogram.
rng("twister") % For reproducibility
mu = 0;
sigma = 1;
normalpd = makedist("Normal");
x = random(normalpd, [100 1]);
histogram(x)
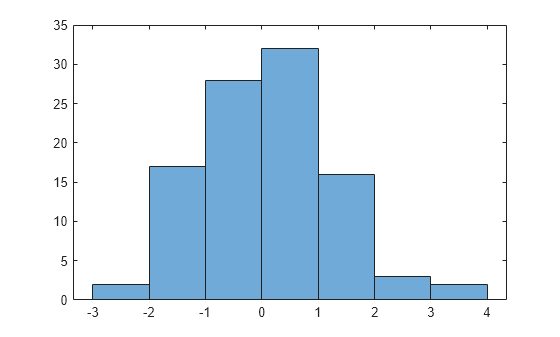
The histogram has a typical bell shape with a single mode.
Create an empirical probability distribution object by using fitdist to fit an empirical distribution to the same data x. The object contains various distribution properties, such as the evaluation points (X), cdf values (FX), and InputData.
empiricalpd =  fitdist(x,"Empirical");
properties(empiricalpd)
Properties for class prob.EmpiricalDistribution:
DistributionName
X
FX
Truncation
IsTruncated
InputData
Plot the evaluation points X and the cdf values FX.
figure
plot(empiricalpd.X,empiricalpd.FX)
hold on
Superimpose the empirical cdf returned by the ecdf function.
empiricalCdf = ecdf(empiricalpd.X);
plot(empiricalpd.X,empiricalCdf)
hold on
Superimpose the normal cdf.
normalCdf = cdf(normalpd,empiricalpd.X);
plot(empiricalpd.X,normalCdf)
legend("FX from empirical distribution object","Empirical cdf from ecdf","Known population (normal) cdf", ...
    "Location","southeast")
hold off
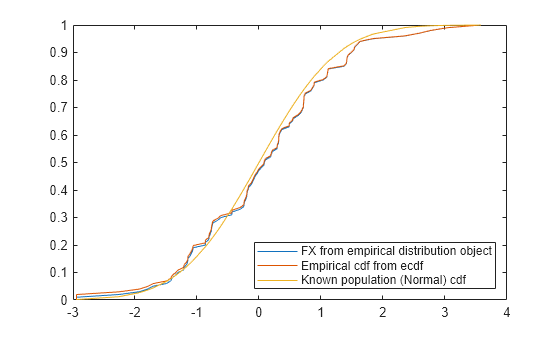
The plot shows that ecdf and FX follow each other closely. The empirical cdf also closely follows the normal distribution cdf.
Alternative Functionality
You can use the distribution-specific function ecdf with a data
sample to evaluate its empirical cdf at a vector of points or a matrix of intervals. Use the
ecdfhist function to calculate heights and bin centers for an empirical
cdf.
Version History
Introduced in R2025a