プログラムによるデータの検証
MATLAB® コマンド ラインからプログラムでシミュレーション データ インスペクターの機能を利用できます。
シミュレーション データ インスペクターでは実行と信号のデータを整理し、それぞれの実行と信号に固有の数値識別子を割り当てます。Simulink.sdi.Run オブジェクトと Simulink.sdi.Signal オブジェクトでデータにアクセスし、実行と信号のメタデータを表示および変更できます。シミュレーション データ インスペクターをプログラムで操作する場合、入力として Signal オブジェクトまたは Run オブジェクトを必要とする関数もあれば、信号 ID または実行 ID を使用する関数もあります。次の表に、このようなオブジェクトと ID にアクセスする方法を示します。
| アクション | 関数 | 必要な入力 |
|---|---|---|
| 実行 ID へのアクセス | Simulink.sdi.getAllRunIDs | なし |
Simulink.sdi.getRunIDByIndex | シミュレーション データ インスペクター リポジトリ内の実行のインデックス | |
Simulink.sdi.Run オブジェクトへのアクセス | Simulink.sdi.Run.getLatest | なし |
Simulink.sdi.getCurrentSimulationRun | モデル名 | |
Simulink.sdi.getRun | 実行 ID | |
| 信号 ID へのアクセス | getAllSignalIDs | Run オブジェクト |
getSignalIDByIndex | Run オブジェクトおよび実行内の信号のインデックス | |
getSignalIDsByName | Run オブジェクトおよび信号名 | |
Simulink.sdi.Signal オブジェクトへのアクセス | getAllSignals | Run オブジェクト |
getSignalByIndex | Run オブジェクトおよび実行内の信号のインデックス | |
getSignalsByName | Run オブジェクトおよび信号名 | |
Simulink.sdi.getSignal | 信号 ID |
Simulink.sdi.setSubPlotLayout、Simulink.sdi.setRunNamingRule、Simulink.sdi.setVisualization などの関数を使用してシミュレーション データ インスペクターの基本設定を変更できます。シミュレーション データ インスペクターの既定の設定に戻すには、Simulink.sdi.clearPreferences を使用します。
実行の作成とデータの表示
実行を作成してそこにデータを追加してから、シミュレーション データ インスペクターでデータを表示します。
実行のデータの作成
2 つの timeseries オブジェクトを作成し、正弦信号と余弦信号のデータを含めます。各 timeseries オブジェクトに説明的な名前を付けます。
time = linspace(0,20,101);

sine_vals = sin(2*pi/5*time);
sine_ts = timeseries(sine_vals,time);
sine_ts.Name = "Sine, T=5";

cos_vals = cos(2*pi/8*time);
cos_ts = timeseries(cos_vals,time);
cos_ts.Name = "Cosine, T=8";
実行の作成とデータの追加
関数 Simulink.sdi.view を使用して、シミュレーション データ インスペクターを開きます。
Simulink.sdi.view
データをワークスペースからシミュレーション データ インスペクターにインポートするには、関数 Simulink.sdi.Run.create を使用して Simulink.sdi.Run オブジェクトを作成します。Run オブジェクトの Name プロパティと Description プロパティを使用して、実行に関する情報をそのメタデータに追加します。
sinusoidsRun = Simulink.sdi.Run.create;
sinusoidsRun.Name = "Sinusoids";
sinusoidsRun.Description = "Sine and cosine signals with different frequencies";
関数 add を使用して、ワークスペースで作成したデータを空の実行に追加します。
add(sinusoidsRun,"vars",sine_ts,cos_ts);シミュレーション データ インスペクターでのデータのプロット
関数 getSignalByIndex を使用して、信号データが含まれる Simulink.sdi.Signal オブジェクトにアクセスします。Simulink.sdi.Signal オブジェクトのプロパティを使用して、信号のライン スタイルと色を指定し、シミュレーション データ インスペクターに信号をプロットできます。各信号の LineColor プロパティと LineDashed プロパティを指定します。
sine_sig = getSignalByIndex(sinusoidsRun,1);
sine_sig.LineColor = [0 0 1];
sine_sig.LineDashed = "-.";

cos_sig = sinusoidsRun.getSignalByIndex(2);
cos_sig.LineColor = [1 0 0];
cos_sig.LineDashed = "--";
関数 Simulink.sdi.setSubPlotLayout を使用して、シミュレーション データ インスペクターのプロット領域で 2 行 1 列のサブプロット レイアウトを設定します。次に、関数 plotOnSubplot を使用して、上のサブプロットに正弦信号をプロットし、下のサブプロットに余弦信号をプロットします。
Simulink.sdi.setSubPlotLayout(2,1);

plotOnSubPlot(sine_sig,1,1,true);
plotOnSubPlot(cos_sig,2,1,true);

カーソルを使用したデータの検査
特定の時間における信号の値にアクセスするには、カーソルをプロットに追加します。たとえば、Sine 信号は、約 6 秒の時点で局所的最大値をもつように表示されます。1 つのカーソルをプロットに追加して、6 秒時点での信号値を確認します。
Simulink.sdi.setNumCursors(1)
Simulink.sdi.setCursorPositions("left",6)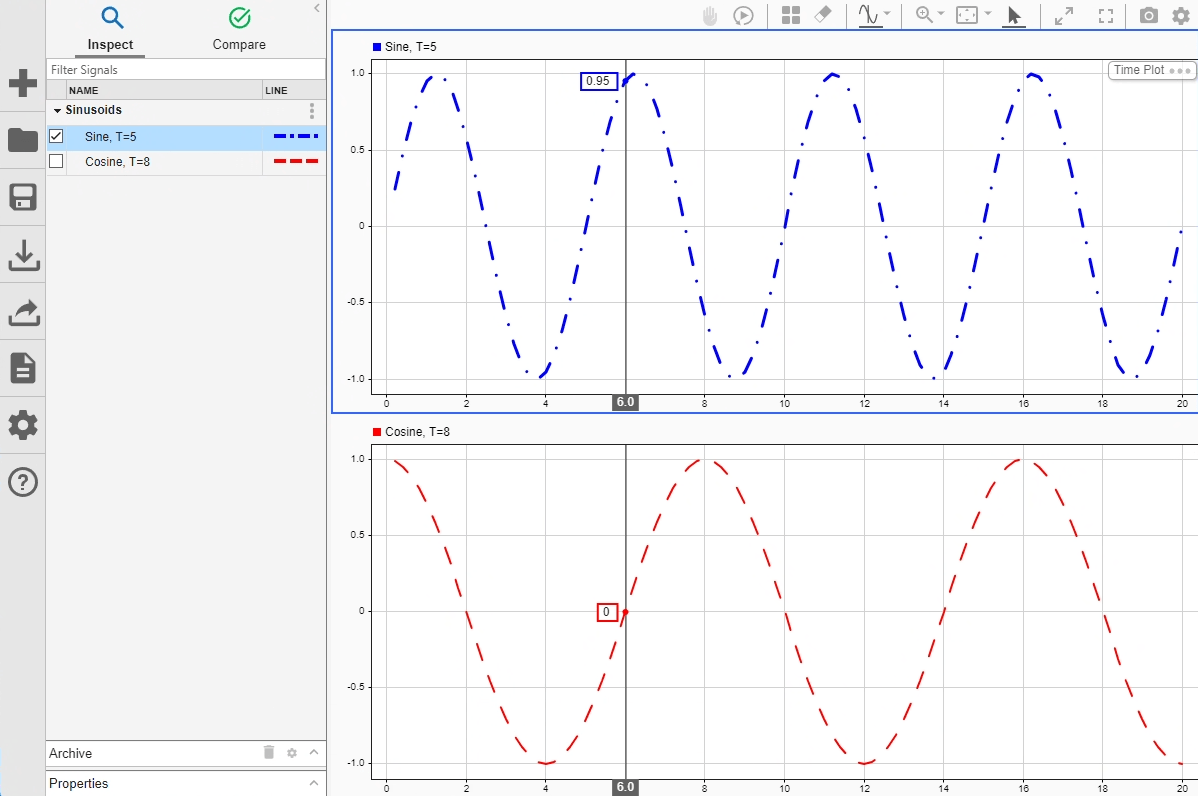
2 つのカーソルをプロット上に配置して、2 点間での時間差を測定するか、定義した区間内の記述統計を抽出します。
Simulink.sdi.setNumCursors(2)
Simulink.sdi.setCursorPositions("left",5,"right",7)
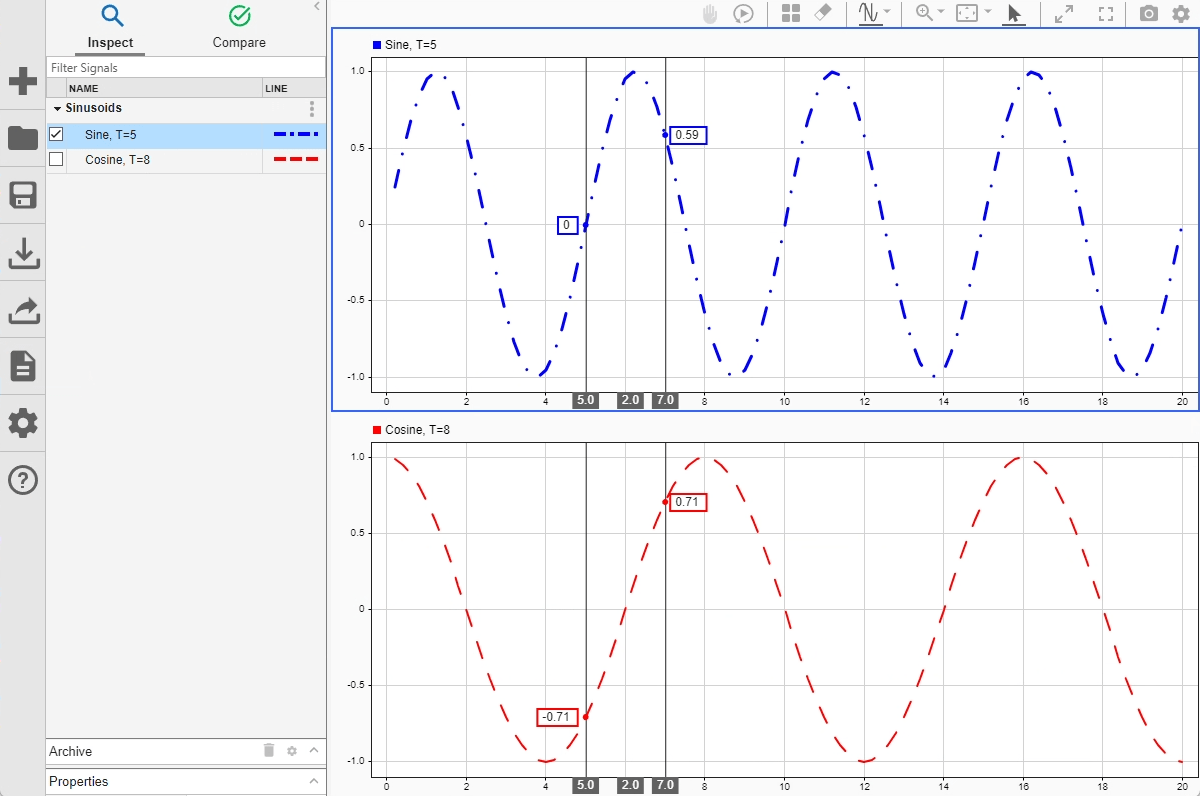
max関数を使用して、カーソル間の Sine 信号の局所的な最大サンプル値を決定します。
[t1,t2] = Simulink.sdi.getCursorPositions;
localMax = max(sine_sig,t1,t2)
localMax =
0.9980
シミュレーション データ インスペクターを閉じてデータを保存
プロットされた信号データの検査が完了したら、シミュレーション データ インスペクターを閉じて、セッションを MLDATX ファイルに保存できます。
Simulink.sdi.close("sinusoids.mldatx")