colororder
色の順序のパレットの設定またはクエリ
構文
説明
色の設定
colororder( は、現在の Figure の色の順序に対してパレットを設定します。[色の順序] は、1 つの座標軸内で複数のデータ系列をプロットするために MATLAB® が使用する色の順序を制御します。colorarray)
RGB 3 成分の行列または色名の配列 ( ["red" "green" "blue"] など) として colorarray を指定します。Figure が存在しない場合は MATLAB が Figure を作成し、その Figure についてパレットを設定します。Figure のパレットを設定するときは、その Figure 内にあるすべての座標軸に対しパレットを設定します。
colororder( は、事前定義されたパレット名 (palettename)"gem"、"glow"、または "sail" など) の 1 つとして色を指定します。 (R2023b 以降)
例
Figure の色の順序を 4 色に設定します。1 つの x 座標ベクトルと 4 つの y 座標ベクトルを定義します。次に、それぞれの座標セットをプロットします。
newcolors = [0.83 0.14 0.14
             1.00 0.54 0.00
             0.47 0.25 0.80
             0.25 0.80 0.54];

colororder(newcolors)

% Define coordinates
x = linspace(0,10);
y1 = sin(x);
y2 = sin(x-0.5);
y3 = sin(x-1);
y4 = sin(x-1.5);

% Plot coordinates
plot(x,y1,'LineWidth',2)
hold on
plot(x,y2,'LineWidth',2)
plot(x,y3,'LineWidth',2)
plot(x,y4,'LineWidth',2)
hold off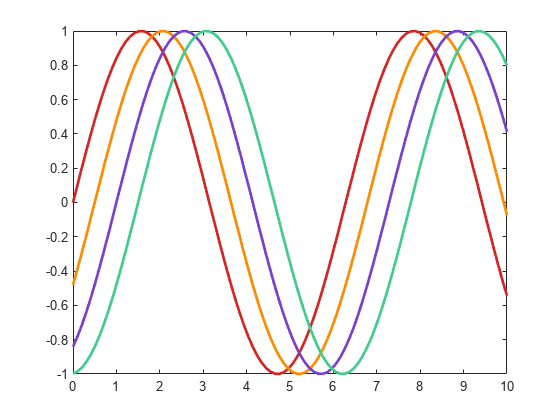
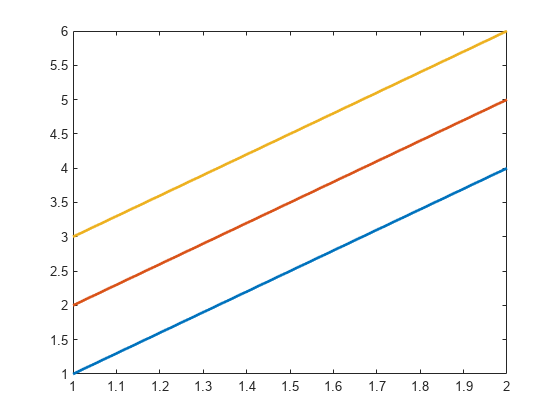
1 つの "x" 座標のベクトルと 1 つの "y" 座標の行列を作成します。次に、座標をプロットします。
x = [1 2];
y = [0 1 2 3; 1 2 3 4];
plot(x,y,"LineWidth",2)
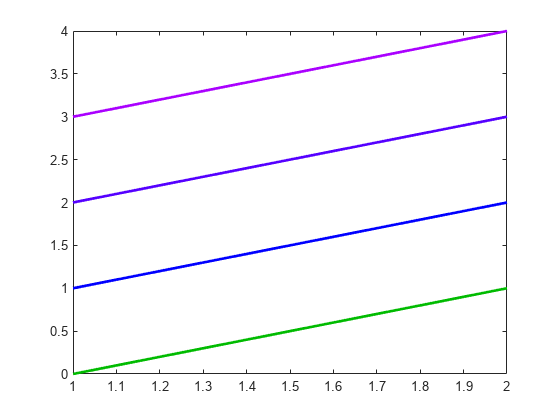
4 つの 16 進数カラー コードを関数 colororder に渡すことで、プロットの色を変更します。
newcolors = ["#0B0" "#00F" "#50F" "#A0F"];
colororder(newcolors)
複数の名前付きカラー パレットのいずれかを指定することもできます。sail という名前のパレットに色を変更します。
colororder("sail")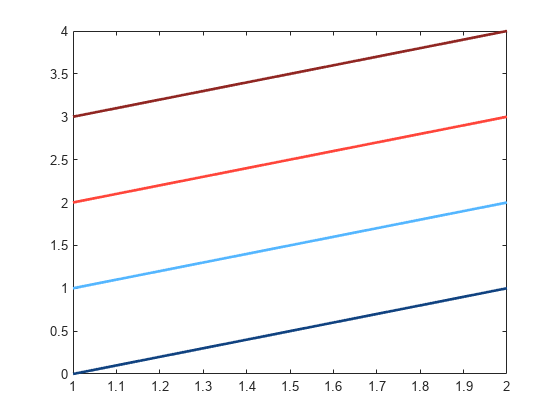
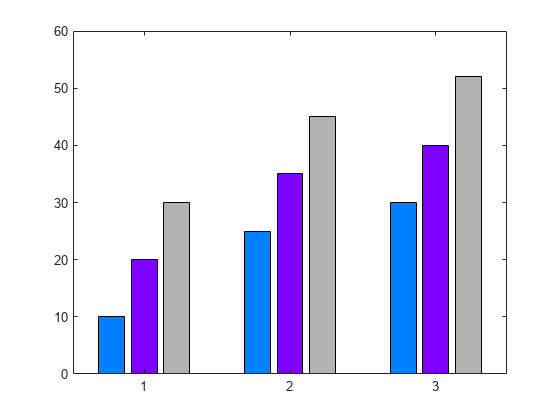
3 系列のバーを表示します。色の順序を、青、紫、グレーに設定します。
bar([10 20 30; 25 35 45; 30 40 52])
newcolors = [0 0.5 1; 0.5 0 1; 0.7 0.7 0.7];
colororder(newcolors)
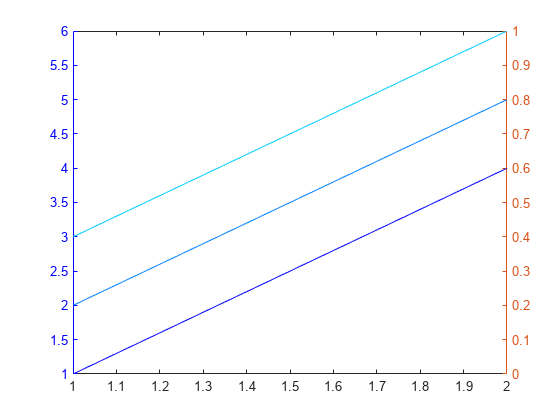
yyaxis を呼び出す前に Figure の色の順序を設定すると、各 y 軸の色が設定されます。左側では最初の色を使用し、右側では 2 番目の色を使用します。2 つより多くの色を指定した場合、追加の色はどちら側でも使用されません。
newcolors を、2 つの RGB 3 成分を含む行列として定義します。Figure の色の順序を設定し、左側に対して 2 本のラインをプロットします。次に、右側に対して 2 本のラインをプロットします。
newcolors = [0.40 0.30 0.90; 0.50 0.65 0.15];
colororder(newcolors)

% Left side
yyaxis left
plot([1 2; 3 4])

% Right side
yyaxis right
plot([4 3; 2 1])

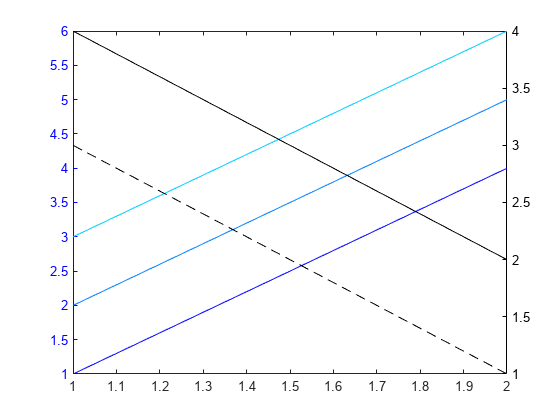
yyaxis を呼び出した後に Figure の色の順序を設定すると、アクティブな側の色が設定されます。
左側の y 軸をアクティブにして 3 本のラインをプロットします。ライン スタイルの順序を 1 本の実線に設定し、y 軸の色を青に変更します。次に、色の順序を 3 階調の青に設定します。
% Left side
yyaxis left
plot([1 2 3; 4 5 6])
ax = gca;
ax.LineStyleOrder = '-';
ax.YColor = 'blue';
leftcolors = [0 0 1; 0 0.50 1; 0 0.80 1];
colororder(leftcolors)
右側の y 軸をアクティブにして 2 本のラインをプロットします。y 軸の色を黒に変更します。次に、色の順序を黒に設定します。
% Right side
yyaxis right
plot([4 3; 2 1])
ax.YColor = 'black';
colororder('black')
色の引数を指定してプロット関数を呼び出すと、プロット関数はその色を使用し、色の順序における次の色は使用しません。
Figure の色の順序を、赤、マゼンタ、青に設定します。関数 scatter を呼び出して散布点の系列をプロットします。次に、2 番目の点の系列をプロットし、マーカーを黒のアスタリスクとして指定します。
newcolors = {'red','magenta','blue'};
colororder(newcolors)
scatter(1:10,rand(1,10),'filled')
hold on
scatter(1:10,rand(1,10),'*k')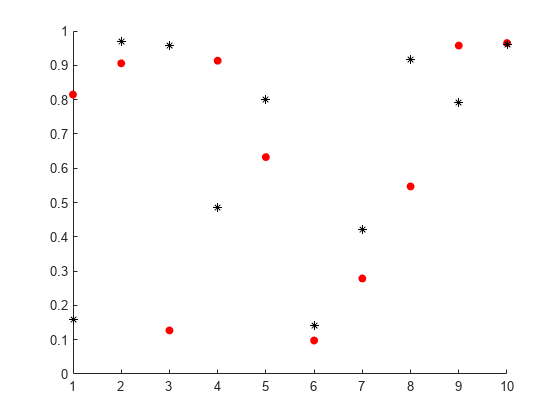
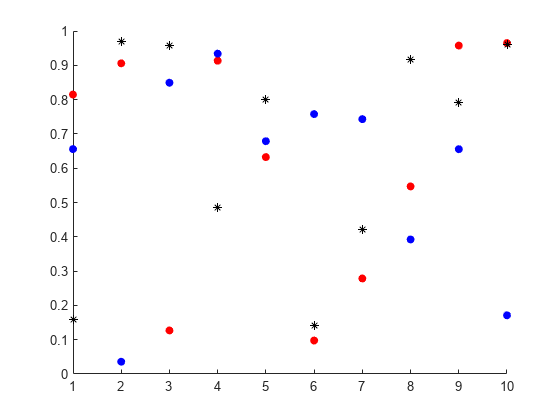
マーカーの色を指定せずに、3 番目の点の系列をプロットします。この系列では、色の順序の 3 番目の色である青が使用されることに注目してください。
scatter(1:10,rand(1,10),'filled')
hold off
タイル表示チャート レイアウトを作成し、最初のタイルに 3 本のラインをプロットします。
tiledlayout('flow')
nexttile
plot([1 2 3; 4 5 6],'LineWidth',2)
2 番目のタイルの axes オブジェクトを取得する戻り引数を指定して関数 nexttile を呼び出します。2 番目のタイルに 3 本のラインをプロットします。次に、座標軸に対する色の順序の行列を取得して、C に出力を返します。C の最初の色を紫に変更し、座標軸の色の順序を変更後の C 行列に設定します。
ax = nexttile;
plot(ax,[4 5 6; 1 2 3],'LineWidth',2)
C = colororder(ax);
C(1,:) = [0.5 0 1];
colororder(ax,C)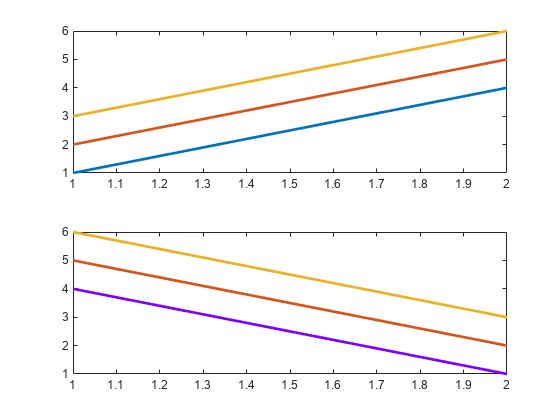
R2023b 以降
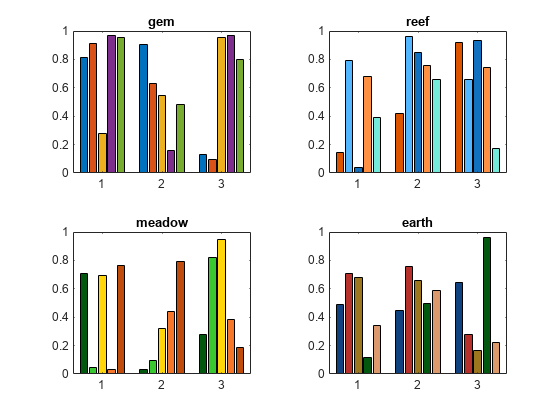
名前付きパレットは、チャートの色を変更する便利な方法です。次の例では、タイル表示チャート レイアウト内の 4 つの異なるパレットを比較します。
関数 nexttile を呼び出して、1 つの axes オブジェクトを含むタイル表示チャート レイアウトを作成します。次に、既定のパレット gem を使用して、乱数の棒グラフを作成します。
nexttile
bar(rand(3,5))
title("gem")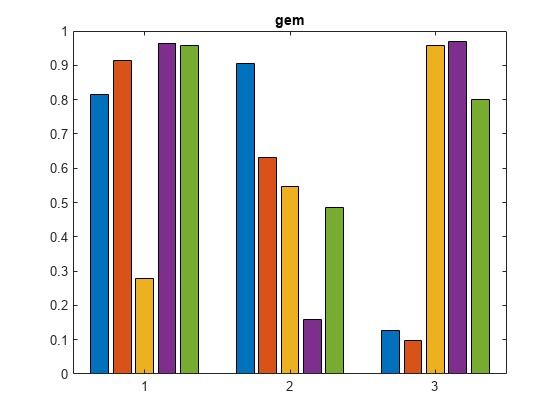
reef、meadow、および earth パレットを使用して、さらに 3 つの棒グラフを作成します。異なる座標軸の色を指定するには、axes オブジェクトを関数 colororder に渡す必要があります。axes オブジェクトを取得するには、nexttile を呼び出す際に出力引数を指定します。
ax2 = nexttile;
bar(rand(3,5))
colororder(ax2,"reef")
title("reef")

ax3 = nexttile;
bar(rand(3,5))
colororder(ax3,"meadow")
title("meadow")

ax4 = nexttile;
bar(rand(3,5))
colororder(ax4,"earth")
title("earth")
入力引数
色の配列。RGB 3 成分の行列、色名の配列として指定します。
RGB 3 成分の行列
各行が RGB 3 成分である m 行 3 列の行列を指定します。RGB 3 成分は、色の赤、緑、青成分の強度を含む 3 要素ベクトルです。強度値は [0,1] の範囲でなければなりません。たとえば、次の行列は新しい色を、青、濃い緑、オレンジとして定義します。
colorarray = [1.0 0.0 0.0
             0.0 0.4 0.0
             1.0 0.5 0.0];
色名または 16 進数カラー コードの配列
色名、省略名、16 進数カラー コードを任意に組み合わせて指定します。
1 つの色を指定するには、
colorarrayを文字ベクトルまたは string スカラーに設定します。たとえば、colorarray = 'red'は、色の順序の唯一の色として赤を指定します。複数の色を指定するには、
colorarrayを文字ベクトルの cell 配列または string 配列に設定します。たとえば、colorarray = {'red','green','blue'}は、色として赤、緑、青を指定します。
16 進数カラー コードはハッシュ記号 (#) で開始し、0 ~ F の範囲で 3 桁または 6 桁の 16 進数が続きます。この値は大文字と小文字を区別しません。したがって、カラー コード '#FF8800'、'#ff8800'、'#F80'、および '#f80' は等価です。
次の表に、色名と省略名を、等価の RGB 3 成分および 16 進数カラー コードと共に示します。
| 色名 | 省略名 | RGB 3 成分 | 16 進数カラー コード | 外観 |
|---|---|---|---|---|
"red" | "r" | [1 0 0] | "#FF0000" |
|
"green" | "g" | [0 1 0] | "#00FF00" |
|
"blue" | "b" | [0 0 1] | "#0000FF" |
|
"cyan" | "c" | [0 1 1] | "#00FFFF" |
|
"magenta" | "m" | [1 0 1] | "#FF00FF" |
|
"yellow" | "y" | [1 1 0] | "#FFFF00" |
|
"black" | "k" | [0 0 0] | "#000000" |
|
"white" | "w" | [1 1 1] | "#FFFFFF" |
|


データ型: single | double | char | cell | string
R2023b 以降
事前定義されたパレット名。次の表のいずれかの値または "default" ("gem" と同じ) として指定します。
| パレット名 | パレットの色 |
|---|---|
|
|
|
|
|
|
|
|
|
|
|
|
|
|
|
|
|
|


ターゲット。次の値のいずれかとして指定します。
Figure。新しい色は、Figure 内のすべての座標軸の内容に影響します。
Axesオブジェクト、PolarAxesオブジェクト、またはGeographicAxesオブジェクトなど、任意のタイプの axes オブジェクト。新しい色は、指定した座標軸の内容にのみ影響します。関数
bubblecloud、piechart、donutchart、stackedplot、scatterhistogram、parallelplot、またはgeobubbleによって作成されたチャートなどのスタンドアロンの可視化。
ヒント
Figure に対し色の順序を設定すると、その色はプロット関数を呼び出すときにも存続します。ただし、axes オブジェクトを関数
colororderに渡す場合は、プロット関数を呼び出すときに色を存続させるために、まずhold onを呼び出さなければなりません。座標軸で
ColorOrderIndexプロパティまたはLineStyleOrderIndexプロパティを設定する場合、新しい色の順序は既存のプロットには影響しません。新しい色は、hold onを呼び出し、プロット関数を呼び出した後に初めて有効になります。
バージョン履歴
R2019b で導入"gem" パレットの色が若干変更されています。次の表は、この変更をまとめたものです。
| R2024b の色 | R2025a の色 | ||||||||||||||||||||||||||||||||
|---|---|---|---|---|---|---|---|---|---|---|---|---|---|---|---|---|---|---|---|---|---|---|---|---|---|---|---|---|---|---|---|---|---|
|
|


