groupsummary
Compute summary statistics by group
Syntax
Description
Table Data
G = groupsummary(T,groupvars)T. Groups are defined by
rows in the variables in groupvars that have the same unique
combination of values. Each row of the output table corresponds to one group.
For example, G = groupsummary(T,"HealthStatus") returns a
table with the count of each group in the variable
HealthStatus.
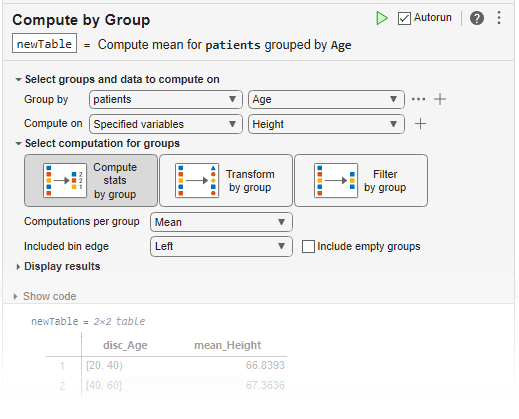
You can use groupsummary functionality interactively by
adding the Compute by
Group task to a live script.
For more information, see Group Summary Computation.
G = groupsummary(T,groupvars,method)method and appends the computation results to the output
table as additional variables. For example, G =
groupsummary(T,"Location","median") returns the median value of
every nongrouping variable in T for each location, in
addition to the number of members in each location group.
G = groupsummary(___,Name,Value)G =
groupsummary(T,"Category1","IncludeMissingGroups",false) excludes
the group made from missing data of type categorical
indicated by <undefined> in
Category1.
Array Data
B = groupsummary(A,groupvars,method)method to unique groups in vector, matrix, or cell array
A. Groups are defined by rows in the column vectors in
groupvars that have the same unique combination of
values. Each row of the output array contains the computation results for one
group.
You can use groupsummary functionality interactively by
adding the Compute by
Group task to a live script.
B = groupsummary(___,Name,Value)
Examples
Compute summary statistics on table variables.
Create a table T that contains information about eight individuals.
HealthStatus = categorical(["Poor"; "Good"; "Fair"; "Fair"; "Poor"; "Excellent"; "Good"; "Excellent"]);
Age = [38; 43; 38; 40; 49; 51; 52; 35];
Height = [71; 68; 64; 67; 64; 62; 65; 55];
Weight = [176; 153; 131; 133; 119; 120; 140; 129];
T = table(HealthStatus,Age,Height,Weight)
T=8×4 table
    HealthStatus    Age    Height    Weight
    ____________    ___    ______    ______

     Poor           38       71       176
     Good           43       68       153
     Fair           38       64       131
     Fair           40       67       133
     Poor           49       64       119
     Excellent      51       62       120
     Good           52       65       140
     Excellent      35       55       129
Compute the counts of the health status groups by specifying HealthStatus as the grouping variable.
G = groupsummary(T,"HealthStatus")G=4×2 table
HealthStatus GroupCount
____________ __________
Excellent 2
Fair 2
Good 2
Poor 2
Compute the mean age, height, and weight of each health status group.
G = groupsummary(T,"HealthStatus","mean")
G=4×5 table
    HealthStatus    GroupCount    mean_Age    mean_Height    mean_Weight
    ____________    __________    ________    ___________    ___________

     Excellent          2             43         58.5           124.5
     Fair               2             39         65.5             132
     Good               2           47.5         66.5           146.5
     Poor               2           43.5         67.5           147.5
Still grouping by health status, compute only the median height.
G = groupsummary(T,"HealthStatus","median","Height")
G=4×3 table
    HealthStatus    GroupCount    median_Height
    ____________    __________    _____________

     Excellent          2             58.5
     Fair               2             65.5
     Good               2             66.5
     Poor               2             67.5
Group table data using two grouping variables.
Create a table T that contains information about eight individuals.
HealthStatus = categorical(["Poor"; "Good"; "Fair"; "Fair"; "Poor"; "Excellent"; "Good"; "Excellent"]);
Smoker = logical([1; 0; 0; 1; 1; 0; 0; 1]);
Weight = [176; 153; 131; 133; 119; 120; 140; 129];
T = table(HealthStatus,Smoker,Weight)
T=8×3 table
    HealthStatus    Smoker    Weight
    ____________    ______    ______

     Poor           true       176
     Good           false      153
     Fair           false      131
     Fair           true       133
     Poor           true       119
     Excellent      false      120
     Good           false      140
     Excellent      true       129
Compute the mean weight, grouped by health status and smoking status. By default, some combinations of health status and smoking status are not represented in the output because they are empty groups.
G = groupsummary(T,["HealthStatus","Smoker"],"mean","Weight")
G=6×4 table
    HealthStatus    Smoker    GroupCount    mean_Weight
    ____________    ______    __________    ___________

     Excellent      false         1              120
     Excellent      true          1              129
     Fair           false         1              131
     Fair           true          1              133
     Good           false         2            146.5
     Poor           true          2            147.5
Set the value of IncludeEmptyGroups to true to see all group combinations, including the empty ones.
G = groupsummary(T,["HealthStatus","Smoker"],"mean","Weight","IncludeEmptyGroups",true)
G=8×4 table
    HealthStatus    Smoker    GroupCount    mean_Weight
    ____________    ______    __________    ___________

     Excellent      false         1              120
     Excellent      true          1              129
     Fair           false         1              131
     Fair           true          1              133
     Good           false         2            146.5
     Good           true          0              NaN
     Poor           false         0              NaN
     Poor           true          2            147.5
Group data according to specified bins.
Create a timetable that contains sales information for days within a single month.
TimeStamps = datetime([2017 3 4; 2017 3 2; 2017 3 15; 2017 3 10; ...
                       2017 3 14; 2017 3 31; 2017 3 25; ...
                       2017 3 29; 2017 3 21; 2017 3 18]);
Profit = [2032 3071 1185 2587 1998 2899 3112 909 2619 3085]';
ItemsSold = [14 13 8 5 10 16 8 6 7 11]';
TT = timetable(TimeStamps,Profit,ItemsSold)
TT=10×2 timetable
    04-Mar-2017    2032    14
    02-Mar-2017    3071    13
    15-Mar-2017    1185    8
    10-Mar-2017    2587    5
    14-Mar-2017    1998    10
    31-Mar-2017    2899    16
    25-Mar-2017    3112    8
    29-Mar-2017    909    6
    21-Mar-2017    2619    7
    18-Mar-2017    3085    11
Compute the mean and the mode of profit binned by the items sold, binning the groups into intervals of item numbers.
format shorte
G = groupsummary(TT,"ItemsSold",[0 4 8 12 16],{"mean","mode"},"Profit")
G=3×4 table
    [4, 8)    3    2.0383e+03    909
    [8, 12)    4    2.3450e+03    1185
    [12, 16]    3    2.6673e+03    2032
Compute the mean profit grouped by day of the week.
G = groupsummary(TT,"TimeStamps","dayname","mean","Profit")
G=5×3 table
    Tuesday    2    2.3085e+03
    Wednesday    2    1.0470e+03
    Thursday    1    3.0710e+03
    Friday    2    2.7430e+03
    Saturday    3    2.7430e+03
Create a vector of dates and a vector of corresponding profit values.
TimeStamps = datetime([2017 3 4; 2017 3 2; 2017 3 15; 2017 3 10; ...
                       2017 3 14; 2017 3 31; 2017 3 25; ...
                       2017 3 29; 2017 3 21; 2017 3 18]);
Profit = [2032 3071 1185 2587 1998 2899 3112 909 2619 3085]';
Compute the mean profit for each day of the week. Display the mean, the group names, and the number of members in each group.
format shorte
[meanDailyProfit,dayOfWeek,dailyCounts] = groupsummary(Profit,TimeStamps,"dayname","mean")
meanDailyProfit = 5×1

   2.3085e+03
   1.0470e+03
   3.0710e+03
   2.7430e+03
   2.7430e+03
dayOfWeek = 5×1 categorical
     Tuesday
     Wednesday
     Thursday
     Friday
     Saturday
dailyCounts = 5×1

     2
     2
     1
     2
     3
Compute the mean weights for a set of people grouped by their health status and smoker status.
Store information about the individuals as three vectors of different types.
HealthStatus = categorical(["Poor"; "Good"; "Fair"; "Fair"; "Poor"; "Excellent"; "Good"; "Excellent"]);
Smoker = logical([1; 0; 0; 1; 1; 0; 0; 1]);
Weight = [176; 153; 131; 133; 119; 120; 140; 129];
Grouping by health status and smoker status, compute the mean weights.
B contains the mean for each group (NaN for empty groups). BG is a cell array containing two vectors that describe the groups as you look at their elements row-wise. For instance, the first row of BG{1} indicates that the patients in the first group have a health status Excellent, and the first row of BG{2} indicates that they are nonsmokers. Finally, BC contains the number of members in each group for the corresponding groups in BG.
[B,BG,BC] = groupsummary(Weight,{HealthStatus,Smoker},"mean","IncludeEmptyGroups",true);
B
B = 8×1
120.0000
129.0000
131.0000
133.0000
146.5000
NaN
NaN
147.5000
BG{1}ans = 8×1 categorical
Excellent
Excellent
Fair
Fair
Good
Good
Poor
Poor
BG{2}ans = 8×1 logical array
0
1
0
1
0
1
0
1
BC
BC = 8×1

     1
     1
     1
     1
     2
     0
     0
     2
Load data containing patient information and create a table describing each patient's location, systolic and diastolic blood pressure, height, and weight.
load patients
Location = categorical(Location);
T = table(Location,Systolic,Diastolic,Height,Weight)T=100×5 table
Location Systolic Diastolic Height Weight
_________________________ ________ _________ ______ ______
County General Hospital 124 93 71 176
VA Hospital 109 77 69 163
St. Mary's Medical Center 125 83 64 131
VA Hospital 117 75 67 133
County General Hospital 122 80 64 119
St. Mary's Medical Center 121 70 68 142
VA Hospital 130 88 64 142
VA Hospital 115 82 68 180
St. Mary's Medical Center 115 78 68 183
County General Hospital 118 86 66 132
County General Hospital 114 77 68 128
St. Mary's Medical Center 115 68 66 137
VA Hospital 127 74 71 174
VA Hospital 130 95 72 202
St. Mary's Medical Center 114 79 65 129
VA Hospital 130 92 71 181
⋮
Grouping by location, compute the correlation between patient height and weight and the correlation between systolic and diastolic blood pressure. Use the xcov function as the method to compute the correlation. The first two input arguments to xcov describe the data to correlate, the third argument describes the lag size, and the fourth argument describes the type of normalization. For each group computation, the x and y arguments passed to xcov are specified pairwise by variable from the two cell elements ["Height","Systolic"] and ["Weight","Diastolic"].
G = groupsummary(T,"Location",@(x,y) xcov(x,y,0,"coeff"),{["Height","Systolic"],["Weight","Diastolic"]})
G=3×4 table
            Location             GroupCount    fun1_Height_Weight    fun1_Systolic_Diastolic
    _________________________    __________    __________________    _______________________

    County General Hospital          39             0.65483                  0.44187
    St. Mary's Medical Center        24             0.62047                  0.44466
    VA Hospital                      37             0.78438                  0.62256
Alternatively, if your data is in vector or matrix form instead of in a table, you can provide the data to correlate as the first input argument of groupsummary.
[B,BG,BC] = groupsummary({[Height,Systolic],[Weight,Diastolic]},Location,@(x,y) xcov(x,y,0,"coeff"))B = 3×2
0.6548 0.4419
0.6205 0.4447
0.7844 0.6226
BG = 3×1 categorical
     County General Hospital
     St. Mary's Medical Center
     VA Hospital
BC = 3×1

    39
    24
    37
Input Arguments
Input table, specified as a table or timetable.
Input array, specified as a column vector, group of column vectors stored as a matrix, or cell array of column vectors, character row vectors, or matrices.
When you specify a function handle for method that
takes more than one input argument, the input array A
must be a cell array of column vectors, character row vectors, or matrices.
In each call to the function by group, the input arguments are the
corresponding columns of each element in the cell array. For example:
groupsummary({x1,y1},groupvars,@(x,y) myFun(x,y))calculatesmyFun(x1,y1)for each group.groupsummary({[x1 x2],[y1 y2]},groupvars,@(x,y) myFun(x,y))first calculatesmyFun(x1,y1)for each group and then calculatesmyFun(x2,y2)for each group.
Grouping variables or vectors, specified as one of these options:
For array input data,
groupvarscan be either a column vector with the same number of rows asAor a group of column vectors arranged in a matrix or cell array.For table or timetable input data,
groupvarsindicates which variables to use to compute groups in the data. You can specify the grouping variables with any of the options in this table.Indexing Scheme Values to Specify Examples Variable name
A string scalar or character vector
A string array or cell array of character vectors
A
patternobject
"A"or'A'— A variable namedA["A" "B"]or{'A','B'}— Two variables namedAandB"Var"+digitsPattern(1)— Variables named"Var"followed by a single digit
Variable index
An index number that refers to the location of a variable in the table
A vector of numbers
A
logicalvector. Typically, this vector is the same length as the number of variables, but you can omit trailing0(false) values.
3— The third variable from the table[2 3]— The second and third variables from the table[false false true]— The third variable
Function handle
A function handle that takes a table variable as input and returns a
logicalscalar
@isnumeric— All the variables containing numeric values
Variable type
A
vartypesubscript that selects variables of a specified type
vartype("numeric")— All the variables containing numeric values
Example: groupsummary(T,"Var3")
Computation method, specified as one of these values:
Method | Description |
|---|---|
"sum" | Sum |
"mean" | Mean |
"median" | Median |
"mode" | Mode |
"var" | Variance |
"std" | Standard deviation |
"min" | Minimum |
"max" | Maximum |
"range" | Maximum minus minimum |
"nummissing" | Number of missing elements |
"numunique" | Number of distinct nonmissing elements |
"nnz" | Number of nonzero and
non- |
"all" | All computations previously listed |
You also can specify method as a function handle that
returns one output per group whose first dimension has length 1. For table
input data, the function operates on each table variable separately.
When the input data is a table T and you specify a
function handle for method that takes more than one input
argument, you must specify datavars. The
datavars argument must be a cell array whose elements
indicate the table variables to use for each input into the method. In each
call to the function by group, the input arguments are the corresponding
table variables of the cell array elements. For example:
groupsummary(T,groupvars,@(x,y) myFun(x,y),{"x1","y1"})calculatesmyFun(T.x1,T.y1)for each group.groupsummary(T,groupvars,@(x,y) myFun(x,y),{["x1" "x2"],["y1" "y2"]})first calculatesmyFun(T.x1,T.y1)for each group and then calculatesmyFun(T.x2,T.y2)for each group.
When the input data is a vector or matrix and you specify a function
handle for method that takes more than one input
argument, the input data A must be a cell array of
vectors or matrices. In each call to the function, the input arguments are
the corresponding columns of each element in the cell array. For example:
groupsummary({x1,y1},groupvars,@(x,y) myFun(x,y))calculatesmyFun(x1,y1)for each group.groupsummary({[x1 x2],[y1 y2]},groupvars,@(x,y) myFun(x,y))first calculatesmyFun(x1,y1)for each group and then calculatesmyFun(x2,y2)for each group.
To specify multiple computations at a time, list the options in a cell
array, such as {"mean","median"} or
{myFun1,myFun2}.
NaN values in the input data are automatically omitted
when using the method names described here, with the exception of
"nummissing". To include NaN
values, use a function handle for the method, such as
@sum instead of "sum".
Data Types: char | string | cell | function_handle
Table variables to operate on, specified as one of the options in this
table. datavars indicates which variables of the input
table or timetable to apply the methods to. Other variables not specified by
datavars are not operated on and do not pass through
to the output. When datavars is not specified,
groupsummary operates on each nongrouping
variable.
| Indexing Scheme | Values to Specify | Examples |
|---|---|---|
Variable name |
|
|
Variable index |
|
|
Function handle |
|
|
Variable type |
|
|
When the input data is a table T and you specify a
function handle for method that takes more than one input
argument, you must specify datavars. The
datavars argument must be a cell array whose elements
are any of the options in the table. The cell array elements indicate the
table variables to use for each input into the method. In each call to the
function by group, the input arguments are the corresponding table variables
of the cell array elements. For example:
groupsummary(T,groupvars,@(x,y) myFun(x,y),{"x1","y1"})calculatesmyFun(T.x1,T.y1)for each group.groupsummary(T,groupvars,@(x,y) myFun(x,y),{["x1" "x2"],["y1" "y2"]})first calculatesmyFun(T.x1,T.y1)for each group and then calculatesmyFun(T.x2,T.y2)for each group.
Example: groupsummary(T,groupvars,method,["Var1" "Var2"
"Var4"])
Binning scheme for grouping variables or vectors, specified as one or more of the following binning methods. Grouping variables or vectors and binning scheme arguments must be the same size, or one of them can be scalar.
"none"— No binning.Vector of bin edges — The bin edges define the bins. You can specify the edges as numeric values or as
datetimevalues fordatetimegrouping variables or vectors.Number of bins — The number determines how many equally spaced bins to create. You can specify the number of bins as a positive integer scalar.
Length of time (bin width) — The length of time determines the width of each bin. You can specify the bin width as a
durationorcalendarDurationscalar fordatetimeordurationgrouping variables or vectors.Name of time unit (bin width) — The name of the time unit determines the width of each bin. You can specify the bin width as one of the options in this table for
datetimeordurationgrouping variables or vectors.Value Description Data Type "second"Each bin is 1 second.
datetimeandduration"minute"Each bin is 1 minute.
datetimeandduration"hour"Each bin is 1 hour.
datetimeandduration"day"Each bin is 1 calendar day. This value accounts for daylight saving time shifts.
datetimeandduration"week"Each bin is 1 calendar week. datetimeonly"month"Each bin is 1 calendar month. datetimeonly"quarter"Each bin is 1 calendar quarter. datetimeonly"year"Each bin is 1 calendar year. This value accounts for leap days.
datetimeandduration"decade"Each bin is 1 decade (10 calendar years). datetimeonly"century"Each bin is 1 century (100 calendar years). datetimeonly"secondofminute"Bins are seconds from 0 to 59.
datetimeonly"minuteofhour"Bins are minutes from 0 to 59.
datetimeonly"hourofday"Bins are hours from 0 to 23.
datetimeonly"dayofweek"Bins are days from 1 to 7. The first day of the week is Sunday.
datetimeonly"dayname"Bins are full day names, such as "Sunday".datetimeonly"dayofmonth"Bins are days from 1 to 31. datetimeonly"dayofyear"Bins are days from 1 to 366. datetimeonly"weekofmonth"Bins are weeks from 1 to 6. datetimeonly"weekofyear"Bins are weeks from 1 to 54. datetimeonly"monthname"Bins are full month names, such as "January".datetimeonly"monthofyear"Bins are months from 1 to 12.
datetimeonly"quarterofyear"Bins are quarters from 1 to 4. datetimeonly
Example: G = groupsummary(T,"Var1",[-Inf 0
Inf])
Example: G = groupsummary(T,["Var1" "Var2"],{"none"
"year"})
Name-Value Arguments
Specify optional pairs of arguments as
Name1=Value1,...,NameN=ValueN, where Name is
the argument name and Value is the corresponding value.
Name-value arguments must appear after other arguments, but the order of the
pairs does not matter.
Example: G =
groupsummary(T,groupvars,groupbins,IncludedEdge="right")
Before R2021a, use commas to separate each name and value, and enclose
Name in quotes.
Example: G =
groupsummary(T,groupvars,groupbins,"IncludedEdge","right")
Included bin edge for binning scheme, specified as either
"left" or "right", indicating
which end of the bin interval is inclusive.
You can specify IncludedEdge only if you also
specify groupbins, and the value applies to all
binning methods for all grouping variables or vectors.
Option to treat missing values as a group, specified as a numeric or
logical 1 (true) or
0 (false). If
IncludeMissingGroups is true,
then groupsummary treats missing values, such as
NaN, in a grouping variable or vector as a group.
If a grouping variable or vector has no missing values, or if
IncludeMissingGroups is false,
then groupsummary does not treat missing values as
a group.
Option to include empty groups in the group summary operation,
specified as a numeric or logical 0
(false) or 1
(true). If IncludeEmptyGroups
is false, then groupsummary
omits empty groups. If IncludeEmptyGroups is
true, then groupsummary
includes empty groups.
An empty group occurs in these cases:
A possible value of a grouping variable or vector is not represented in the input data, such as in a categorical, logical, or binned numeric variable or vector. For example, if no row in the input table has a value of
truefor a logical grouping variable, thentruedefines an empty group.A unique combination of grouping variables or vectors is not represented in the input data. For example, if there is no row in the input table where the value of grouping variable
AisA1and the value of grouping variableBisB1, thenA1_B1defines an empty group.
Output Arguments
Output table for table or timetable input data, returned as a table.
G contains the computed groups, the number of
elements in each group, and if method is provided, the
result of the specified computations.
Output array for array input data, returned as a vector or matrix.
B contains the specified computations for each group.
When multiple methods are specified, groupsummary
horizontally concatenates the computations in the order that they were
listed.
Groups for array input data, returned as a column vector or cell array of
column vectors. For a single grouping vector, the output groups are sorted
according to the order returned by the unique function with the
"sorted" option.
For more than one input vector, BG is a cell array
containing column vectors of equal length. Information for each group is
contained in the elements of a row across all vectors in
BG. Each group maps to the corresponding row of the
output array B.
Group counts for array input data, returned as a column vector.
BC contains the number of elements in each group. The
length of BC is the same as the length of the group
column vectors returned in BG.
More About
This table illustrates group summary computations.
Sample Table T | Syntax Example | Resulting Table |
|---|---|---|
|
|
groupsummary(T,"VarA") |
|
groupsummary(T,"VarA","mean") |
| |
groupsummary(T,["VarA" "VarB"],{"none",[-Inf 0 Inf]},"min") |
| |
groupsummary(T,"VarA",["mean" "median" "mode"],"VarB") |
|
Tips
When making many calls to
groupsummary, consider converting grouping variables to typecategoricalorlogicalwhen possible for improved performance. For example, if you have a string array grouping variable (such asHealthStatuswith elements"Poor","Fair","Good", and"Excellent"), you can convert it to a categorical variable using the commandcategorical(HealthStatus).The
groupsummaryfunction computes one-dimensional summary statistics. To compute grouped summaries in two dimensions, consider using thepivotfunction.
Alternative Functionality
Live Editor Task
You can use groupsummary functionality interactively by adding
the Compute by
Group task to a live script.
Extended Capabilities
The
groupsummary function supports tall arrays with the following usage
notes and limitations:
If
Aandgroupvarsare both tall matrices, then they must have the same number of rows.If the first input is a tall matrix, then
groupvarscan be a cell array containing tall grouping vectors.The
groupvarsanddatavarsarguments do not support function handles.The
IncludeEmptyGroupsname-value argument is not supported.The
"median","mode", and"numunique"methods are not supported and are not included when specifying the"all"method.For tall datetime arrays, the
"std"method is not supported.If the
methodargument is a function handle, then it must be a valid input forsplitapplyoperating on a tall array. If the function handle takes multiple inputs, then the first input togroupsummarymust be a tall table.The order of the groups might be different compared to in-memory
groupsummarycalculations.When grouping by discretized datetime arrays, the categorical group names are different compared to in-memory
groupsummarycalculations.
For more information, see Tall Arrays.
Usage notes and limitations:
Sparse inputs are not supported.
Binning scheme is not supported for datetime or duration data.
Input data that is a heterogeneous cell array with variable-sized contents is not supported.
Input tables that contain multidimensional arrays are not supported.
Input data that contains cell arrays of character vectors or cell arrays of cell arrays is not supported.
Computation methods must be constant.
Grouping variables must be constant when the first input argument is a table.
Data variables must be constant.
Data variables cannot be nested tables.
Binning scheme specified as character vectors or strings must be constant.
Name-value arguments must be constant.
Computation methods cannot return sparse, multidimensional, or cell array results.
If the number of group variables can change at runtime, the second output
BGis a cell array.
Refer to the usage notes and limitations in the C/C++ Code Generation section. The same usage notes and limitations apply to GPU code generation.
The groupsummary function fully supports
thread-based environments. For more information, see Run MATLAB Functions in Thread-Based Environment.
Version History
Introduced in R2018aThe groupsummary function shows improved performance when the
grouping variable or vector type is numeric or string.
When the grouping variable or vector is numeric, the improvement is most
noticeable when the total number of elements and the number of elements per group
are large. When the grouping variable or vector type is string,
the improvement is most noticeable when the total number of elements is large and
the number of elements per group is small.
For example, this code computes the group-wise mean for a numeric vector of length 12,500,000 with 25 groups. The code is about 7.1x faster than in the previous release.
function timingTest
numberOfGroups = 25;
elementsPerGroup = 5e5;
groups = repmat(1:numberOfGroups,1,elementsPerGroup)';
data = randn(numel(groups),1);
G = @() groupsummary(data,groups,"mean");
t = timeit(G)
end
The approximate execution times are:
R2025b: 1.35 s
R2026a: 0.19 s
The code was timed on a Windows® 11, AMD EPYC™ 74F3 24-Core Processor @ 3.19 GHz test system by calling the
timingTest function.
The groupsummary function shows improved performance when you
specify at least two of the "sum", "mean",
"min", or "max" computation methods,
especially when the number of data points per group is small.
For example, this code computes the sum and maximum for a table with one data variable and one grouping variable. The code is about 6.6x faster than in the previous release.
function timingTest
data = rand(1000,1);
groups = categorical(randi(500,[1000 1]));
for i = 1:1200
   groupsummary(data,groups,["sum" "max"]);
end
end
The approximate execution times are:
R2024b: 2.11 s
R2025a: 0.32 s
The code was timed on a Windows 11, AMD EPYC 74F3 24-Core Processor @ 3.19 GHz test system using the
timeit function.
timeit(@timingTest)
Apply multiple binning methods to one grouping variable or vector by specifying a cell array of binning methods.
Compute the number of distinct nonmissing elements in each group of data. Specify
the "numunique" or "all" computation
method.
The "all" computation method now returns the number of unique
values in addition the computation methods in the previous release.
Character arrays have no default definition of a standard missing value.
Therefore, the nummissing method treats blank character array
elements (' ') as nonmissing.
Generate C or C++ code for the groupsummary function. For
usage notes and limitations, see C/C++ Code
Generation.
The groupsummary function shows improved performance,
especially when the data count in each group is small.
For example, this code performs group summary computations on a matrix with 500 groups with a count of 10 each. The code is about 2.70x faster than in the previous release.
function timingGroupsummary
data = (1:5000)';
groups = repelem(1:length(data)/10,10)';
p = randperm(length(data));
data = data(p);
groups = groups(p);

tic
for k = 1:300
   G = groupsummary(data,groups,"mean");
end
toc
end
The approximate execution times are:
R2021b: 2.65 s
R2022a: 0.98 s
The code was timed on a Windows 10, Intel®
Xeon® CPU E5-1650 v4 @ 3.60 GHz test system by calling the
timingGroupsummary function.
The "nummissing" and "nnz" methods no longer
error for input data types with no default definition of a standard missing
value.
Code that relied on the errors that MATLAB threw for those inputs, such as code
within a try/catch block, may no longer catch
those errors.
See Also
Functions
pivot|grouptransform|groupfilter|groupcounts|summary|findgroups|splitapply|discretize|varfun|rowfun|convertvars|vartype|numunique
Live Editor Tasks
MATLAB Command
You clicked a link that corresponds to this MATLAB command:
Run the command by entering it in the MATLAB Command Window. Web browsers do not support MATLAB commands.
Select a Web Site
Choose a web site to get translated content where available and see local events and offers. Based on your location, we recommend that you select: .
You can also select a web site from the following list
How to Get Best Site Performance
Select the China site (in Chinese or English) for best site performance. Other MathWorks country sites are not optimized for visits from your location.
Americas
- América Latina (Español)
- Canada (English)
- United States (English)
Europe
- Belgium (English)
- Denmark (English)
- Deutschland (Deutsch)
- España (Español)
- Finland (English)
- France (Français)
- Ireland (English)
- Italia (Italiano)
- Luxembourg (English)
- Netherlands (English)
- Norway (English)
- Österreich (Deutsch)
- Portugal (English)
- Sweden (English)
- Switzerland
- United Kingdom (English)