birdsEyePlot
検出、軌跡、および車両周囲のセンサー カバレッジのプロット
説明
birdsEyePlot オブジェクトは、自車のごく近傍において、2-D ドライビング シナリオの鳥瞰図プロットを表示します。このプロットと共に、オブジェクトおよび車線を検出可能なセンサーを使用できます。
鳥瞰図プロットにドライビング シナリオの各要素を表示するには、次を行います。
birdsEyePlotオブジェクトを作成します。プロットするドライビング シナリオの各要素用のプロッターを作成します。
プロッターと共に対応するプロット関数を使用して、鳥瞰図プロットにそれらの要素を表示します。
次の表は、プロットするドライビング シナリオの各要素に基づいて使用するプロッター関数を示しています。
| プロットするドライビング シナリオの要素 | プロッター作成関数 | プロッター表示関数 |
|---|---|---|
| センサーのカバレッジ領域 | coverageAreaPlotter | plotCoverageArea |
| センサー検出 | detectionPlotter, rangeDetectionPlotter | plotDetection, plotRangeDetection |
| 車線境界線 | laneBoundaryPlotter | plotLaneBoundary |
| 車線区分線 | laneMarkingPlotter | plotLaneMarking, plotParkingLaneMarking |
| オブジェクト メッシュ | meshPlotter | plotMesh |
| オブジェクト アウトライン | outlinePlotter | plotOutline, plotBarrierOutline |
| 自車のパス | pathPlotter | plotPath |
| 点群 | pointCloudPlotter | plotPointCloud |
| オブジェクトの追跡結果 | trackPlotter | plotTrack |
鳥瞰図プロットを構成して使用する方法の例については、センサー カバレッジ、検出、および追跡の可視化を参照してください。
作成
プロパティ
プロット対象の座標軸。axes ハンドルとして指定します。birdsEyePlot オブジェクトは既定で、現在の axes ハンドルを使用します。これは、関数 gca によって返されます。
鳥瞰図プロット用に作成されるプロッター。プロッター オブジェクトの配列として指定します。
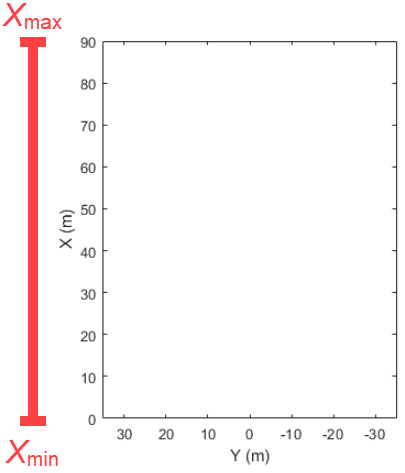
車両座標による鳥瞰図プロットの X 軸の範囲。[Xmin Xmax] 形式の実数値ベクトルとして指定します。単位はメートルです。XLimits を指定しない場合、プロットでは親座標軸の既定値が使用されます。
X 軸は自車に垂直であり、前方が正になります。原点は自車の後車軸の中心です。
鳥瞰図プロットで使用される座標系の詳細については、車両座標系を参照してください。
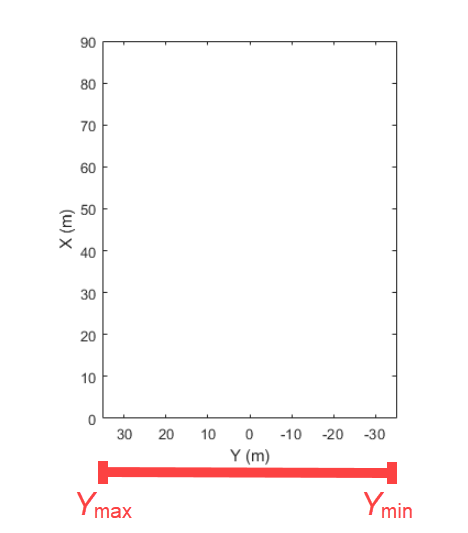
車両座標による鳥瞰図プロットの Y 軸の範囲。[Ymin Ymax] 形式の実数値ベクトルとして指定します。単位はメートルです。YLimits を指定しない場合、プロットでは親座標軸の既定値が使用されます。
Y 軸は水平方向を向き、自車から正面を向いた状態での左が正になります。原点は自車の後車軸の中心です。
birdsEyePlot オブジェクトで使用される座標系の詳細については、車両座標系を参照してください。
オブジェクト関数
例
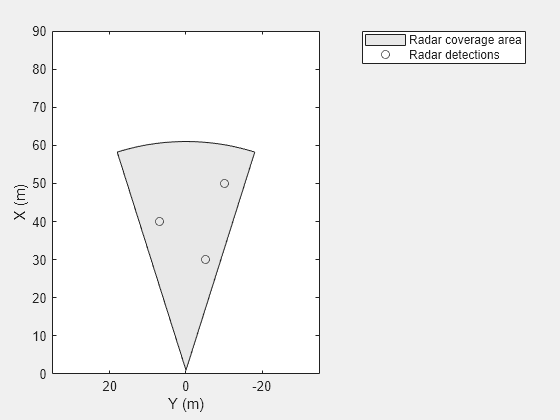
"x" 軸の範囲が 0 ~ 90 メートル、"y" 軸の範囲が -35 ~ 35 メートルの鳥瞰図プロットを作成します。
bep = birdsEyePlot('XLim',[0 90],'YLim',[-35 35]);

視野が 35 度、範囲が 60 メートルのカバレッジ領域を表示します。
caPlotter = coverageAreaPlotter(bep,'DisplayName','Radar coverage area');
mountPosition = [1 0];
range = 60;
orientation = 0;
fieldOfView = 35;
plotCoverageArea(caPlotter,mountPosition,range,orientation,fieldOfView);

座標 (30, -5)、(50, -10)、(40, 7) におけるレーダー検出を表示します。
radarPlotter = detectionPlotter(bep,'DisplayName','Radar detections');
plotDetection(radarPlotter,[30 -5; 50 -10; 40 7]);
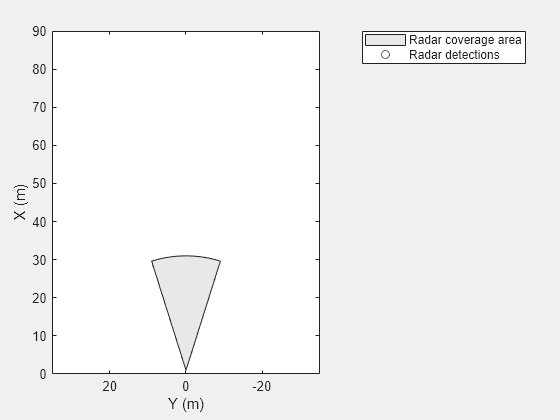
"x" 軸の範囲が 0 ~ 90 メートル、"y" 軸の範囲が -35 ~ 35 メートルの鳥瞰図プロットを作成します。レーダー カバレッジ領域プロッターと検出プロッターを含めるようプロットを構成します。それらのプロッターの表示名を設定します。
bep = birdsEyePlot('XLim',[0 90],'YLim',[-35 35]);
coverageAreaPlotter(bep,'DisplayName','Radar coverage area');
detectionPlotter(bep,'DisplayName','Radar detections');

findPlotter を使用して、プロッターを表示名で見つけます。
caPlotter = findPlotter(bep,'DisplayName','Radar coverage area');
radarPlotter = findPlotter(bep,'DisplayName','Radar detections');
カバレッジ領域と検出したオブジェクトをプロットします。
plotCoverageArea(caPlotter,[1 0],30,0,35);
plotDetection(radarPlotter,[30 5; 30 -10; 30 15]);

プロットからデータをクリアします。
clearPlotterData(bep);
制限
Figure のセクションに四角形を描いてズームインする矩形ズーム機能は、鳥瞰図プロットでは機能しません。
詳細
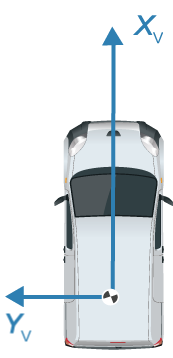
birdsEyePlot は、車両座標系 (XV, YV) を使用します。ここで、
XV 軸は自車の前方向を指します。
YV 軸は、正面を向いた状態の左方向を指します。
原点は自車の回転の中心です。この点は、自車の後車軸の中心の下にある路面上にあります。
車両座標系の詳細については、Automated Driving Toolbox の座標系を参照してください。
バージョン履歴
R2017a で導入