findPlotter
Find plotters associated with bird’s-eye plot
Description
Examples
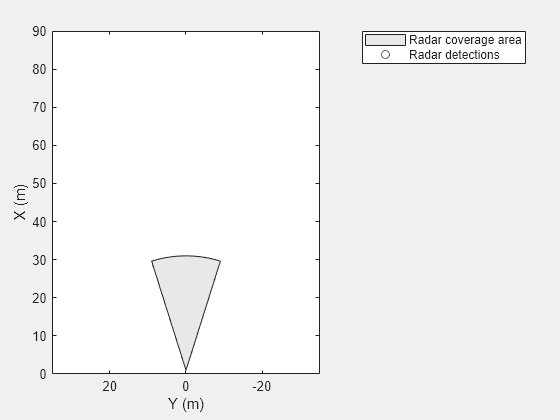
Create a bird's-eye plot with an x-axis range of 0 to 90 meters and a y-axis range from –35 to 35 meters. Configure the plot to include a radar coverage area plotter and a detection plotter. Set the display names of these plotters.
bep = birdsEyePlot('XLim',[0 90],'YLim',[-35 35]);
coverageAreaPlotter(bep,'DisplayName','Radar coverage area');
detectionPlotter(bep,'DisplayName','Radar detections');

Use findPlotter to locate the plotters by their display names.
caPlotter = findPlotter(bep,'DisplayName','Radar coverage area');
radarPlotter = findPlotter(bep,'DisplayName','Radar detections');
Plot the coverage area and detected objects.
plotCoverageArea(caPlotter,[1 0],30,0,35);
plotDetection(radarPlotter,[30 5; 30 -10; 30 15]);

Clear data from the plot.
clearPlotterData(bep);
Input Arguments
Name-Value Arguments
Output Arguments
Version History
Introduced in R2017a