Object Detector Analyzer
Interactively visualize and evaluate object detection results against ground truth
Since R2026a
Description
The Object Detector Analyzer app enables you to visualize and evaluate object detection results against ground truth data. Using the app, you can:
Evaluate object detection performance either without ground truth data or by comparing detections to ground truth and generating performance metrics. To get started, see Get Started with Object Detector Analyzer App.
Run a pretrained object detector in the app, or import precomputed object detection results from the workspace. For a list of supported object detectors to run in the app, see Run Supported Object Detectors. For information about the format of precomputed detection results, see Import Precomputed Detection Results.
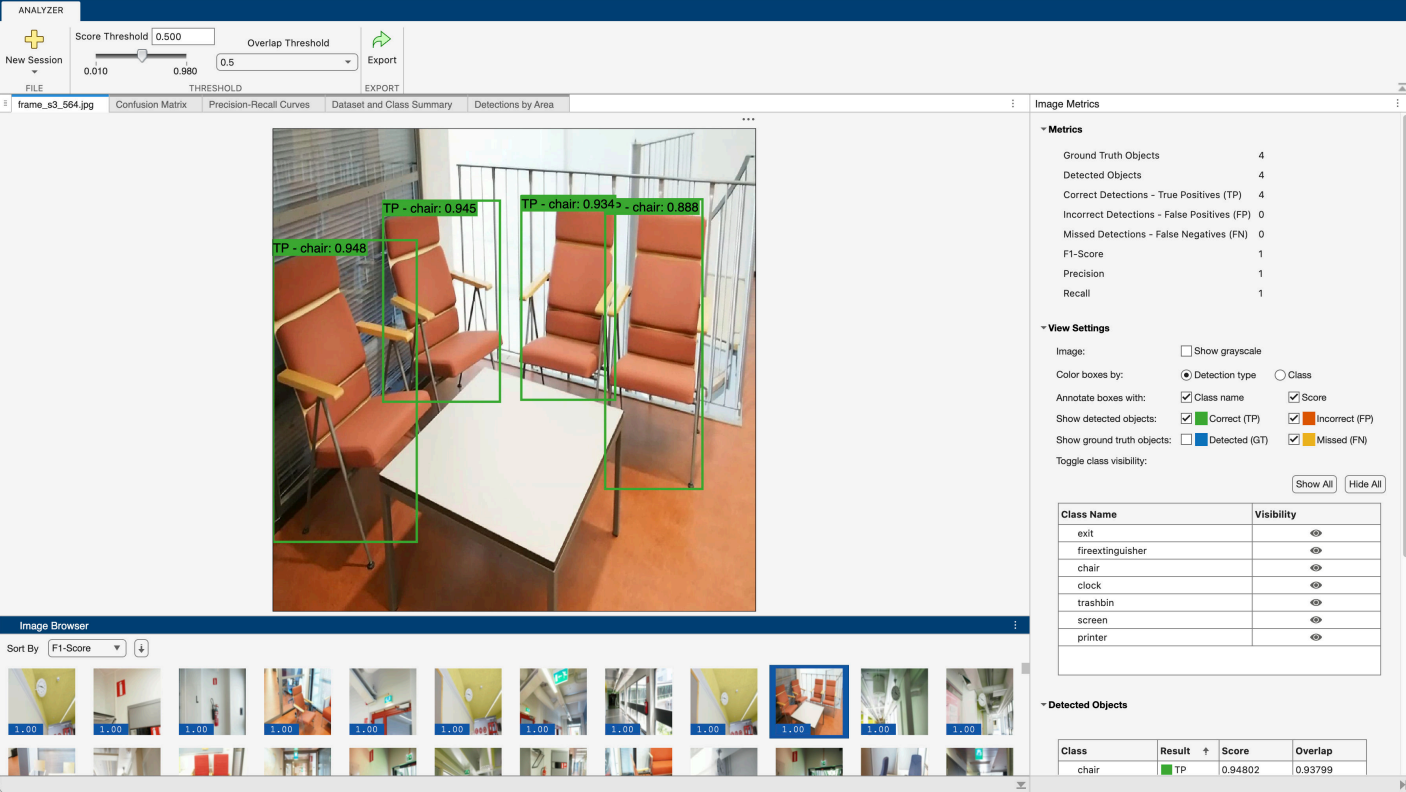
Visualize and compare detections and ground truth annotations in an interactive image browser. Inspect individual detections, and overlay their confidence scores, false positives, and false negatives overlaid on images.
Compute and visualize detector performance metrics: precision-recall curves, confusion matrices, AP, mAP, and mLAMR across data sets, classes, and overlap thresholds, and detection performance by object area. For more information on performance metrics, see Evaluate Object Detector Performance.
Interactively adjust the detection threshold and overlap (IoU) threshold to analyze how stricter or more lenient thresholds impact detector performance, enabling you to tune your detector for the optimal trade-off between false negatives and false positives.
Export all detections or filtered results to the workspace for further analysis.
Export computed performance metrics as an
objectDetectionMetricsobject. You can use this object to create custom visualizations, compare different detector models, or perform further performance analysis.
To learn more about this app, see Get Started with Object Detector Analyzer App.
Open the Object Detector Analyzer App
MATLAB® Toolstrip: On the Apps tab, under Image Processing and Computer Vision, click the app icon.
MATLAB command prompt: Enter
objectDetectorAnalyzer.
Examples
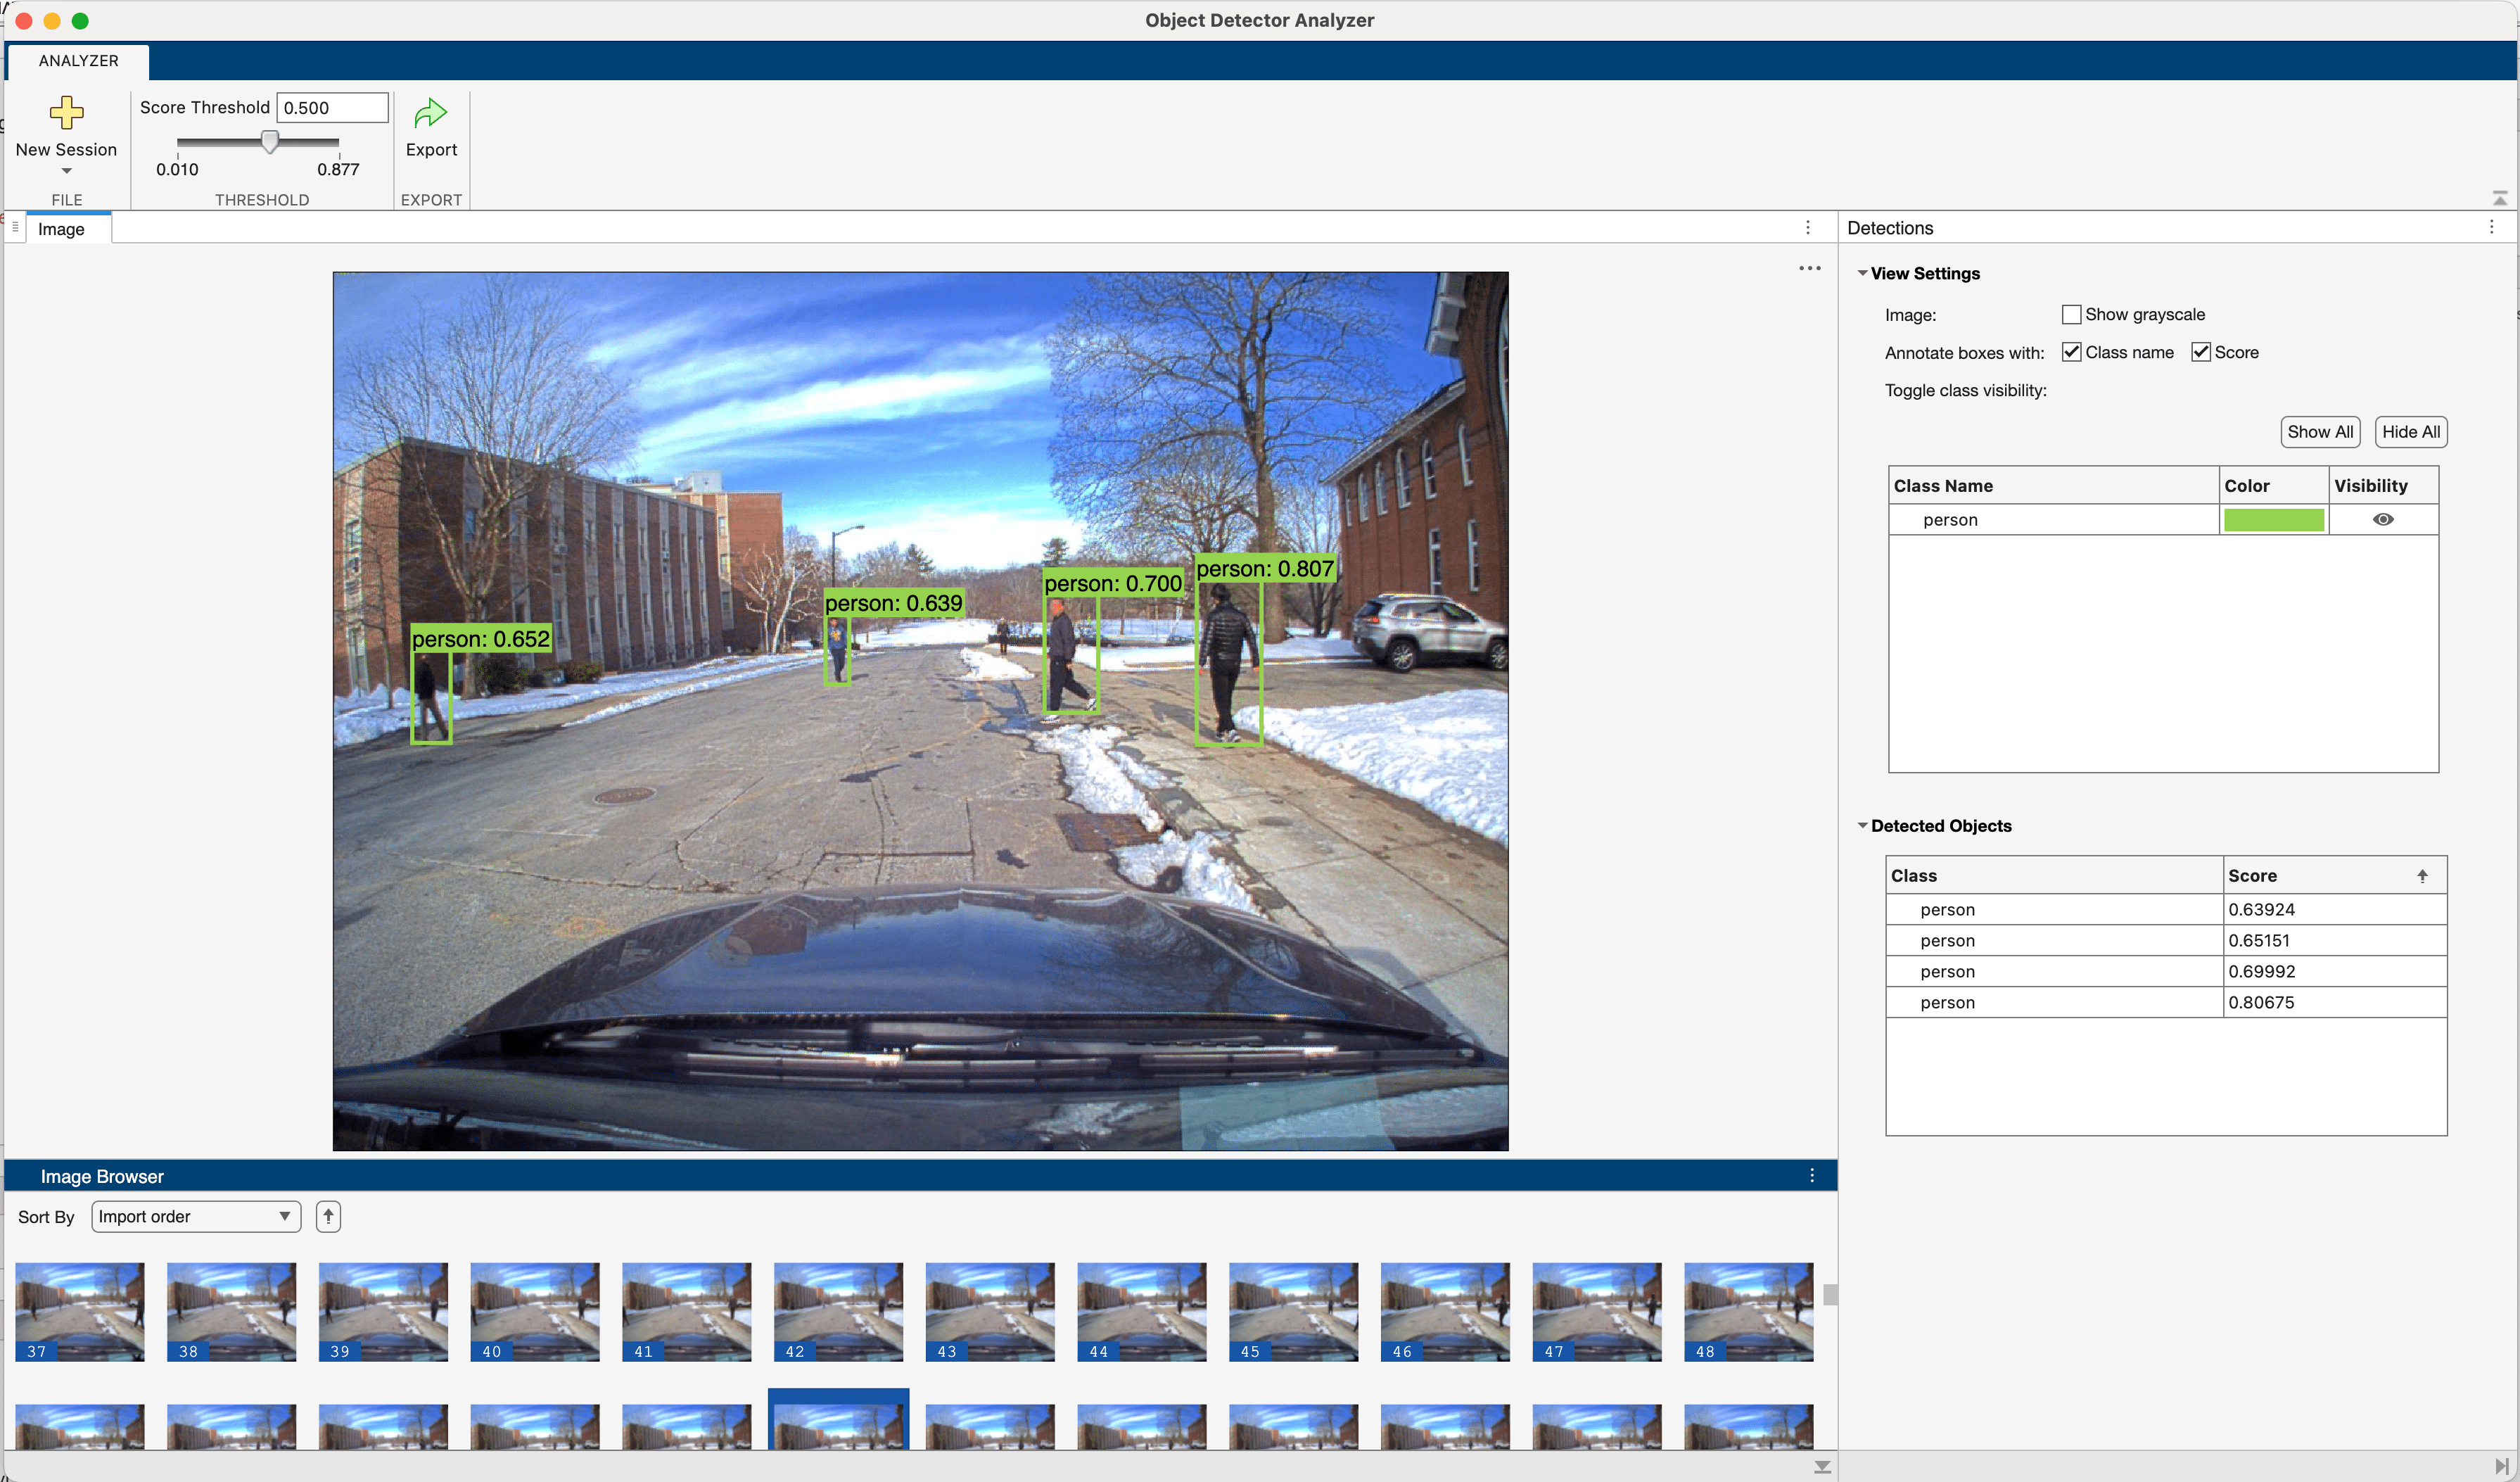
This example shows how to visualize object detections on a video using the Object Detector Analyzer App.
Load detector.
detector = peopleDetector();
Load a video using VideoReader.
videoURL = "https://ssd.mathworks.com/supportfiles/vision/data/PedestrianTrackingVideo.avi";
videoFilename = "PedestrianTrackingVideo.avi";
if ~exist("PedestrianTrackingVideo.avi","file")
disp("Downloading Pedestrian Tracking Video (35 MB)")
    websave(videoFilename,videoURL);
end

reader = VideoReader(videoFilename);
The Object Detector Analyzer App can import any datastore that produces image data. Use an arrayDatastore to produce video frame indices and create a transform datastore that calls VideoReader read object function with the frame indices returned by the arrayDatastore. This will read one frame of video data every time data is read from the datastore.
frameIndexDS = arrayDatastore((1:reader.NumFrames)',IterationDimension=1,OutputType="same");
videoFrameDS = transform(frameIndexDS,@(frameIdx)read(reader,frameIdx));
Launch Object Detector Analyzer App with the detector and the datastore as input. The app will run the detector on the video frames and display the detections on each frame. By default, the video frames are sorted by the number of detections in each frame. You can sort the video frames by Import order using the Sort By dropdown to visualize the video frames in sequence from start to finish.
objectDetectorAnalyzer(detector,videoFrameDS)
Related Examples
Programmatic Use
More About
Version History
Introduced in R2026a