Main Content

evaluateObjectDetection

Evaluate object detection data set against ground truth

Since R2023b

    Description

    example

    metrics = evaluateObjectDetection(detectionResults,groundTruthData) evaluates the quality of the object detection results detectionResults against the labeled ground truth groundTruthData and returns various metrics.

    metrics = evaluateObjectDetection(detectionResults,groundTruthData,threshold) specifies the overlap threshold for assigning an output bounding box to a ground truth bounding box.

    metrics = evaluateObjectDetection(___,Name=Value) specifies one or more name-value arguments, in addition to any combination of input arguments from previous syntaxes, to configure the object detection results evaluation. For example, AdditionalMetrics="AOS" includes average orientation similarity metrics in the output.

    Examples

    collapse all

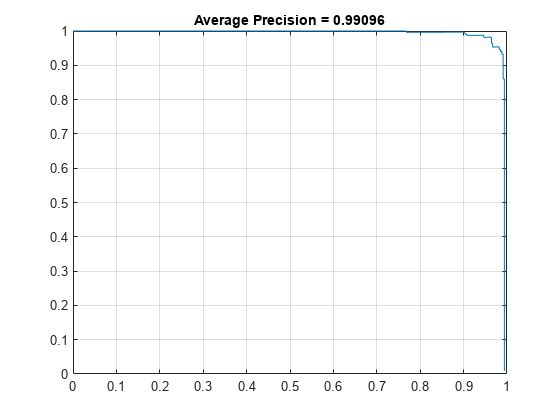
    This example shows how to plot a precision-recall curve for evaluating object detector performance.

    Load a table containing images and ground truth bounding box labels. The first column contains the images, and the remaining columns contain the labeled bounding boxes.

    data = load("vehicleTrainingData.mat");
    trainingData = data.vehicleTrainingData;

    Set the value of the dataDir variable as the location where the vehicleTrainingData.mat file is located. Load the test data into a local vehicle data folder.

    dataDir = fullfile(toolboxdir("vision"),"visiondata");
    trainingData.imageFilename = fullfile(dataDir,trainingData.imageFilename);

    Create an imageDatastore using the files from the table.

    imds = imageDatastore(trainingData.imageFilename);

    Create a boxLabelDatastore using the label columns from the table.

    blds = boxLabelDatastore(trainingData(:,2:end));

    Load Pretrained Object Detector

    Load a pretrained YOLO v2 object detector trained to detect vehicles into the workspace.

    vehicleDetector = load("yolov2VehicleDetector.mat");
    detector = vehicleDetector.detector;

    Evaluate and Plot Object Detection Metrics

    Run the detector on the test images. Set the detection threshold to a low value to detect as many objects as possible. This helps you evaluate the detector precision across the full range of recall values.

    results = detect(detector,imds,Threshold=0.01);

    Use evaluateObjectDetection to compute metrics for evaluating the performance of an object detector.

    metrics = evaluateObjectDetection(results,blds);

    Return the precision, recall, and average precision (AP) metrics for the vehicle class using the objectDetectionMetrics object.

    recall = metrics.ClassMetrics{"vehicle","Recall"};
    precision = metrics.ClassMetrics{"vehicle","Precision"};
    ap = metrics.ClassMetrics{"vehicle","AP"};

    Plot the precision-recall curve.

    figure
    plot(recall{1},precision{1})
    grid on
    title("Average Precision = " + ap{1});

    Input Arguments

    collapse all

    Predicted object detection results, specified as a three-column table containing the bounding box, predicted label, and score for each detected object. The table describes the formats of the required elements.

    Bounding BoxesLabelsScores

    Predicted 2-D bounding boxes for M objects, specified as an M-by-4 or M-by-5 numeric array. Each 2-D bounding box must be in the format [x y width height] if axis-aligned, or in the format [xcenter ycenter width height yaw] if rotated.

    Predicted object labels, specified as an M-by-1 categorical vector.

    Predicted scores, specified as an M-by-1 numeric vector.

    The order of the elements does not matter. When the datastore returns a cell array with more than three elements, the evaluateObjectDetection function assumes that the first element with an M-by-4 or M-by-5 numeric array contains the bounding boxes, the first element with categorical data contains the label data, and the first element with M-by-1 numeric data contains the scores.

    You can create the detection results table using the detect function associated with your object detector..

    Labeled ground truth, specified as a datastore with two outputs or a table with two columns. This table describes the formats of the required elements.

    boxeslabels

    Ground truth 2-D bounding boxes for M objects, specified as an M-by-4 or M-by-5 numeric array. Each 2-D bounding box must be in the format [x y width height] if axis-aligned, or in the format [xcenter ycenter width height yaw] if rotated.

    Ground truth object labels, specified as an M-by-1 categorical vector.

    The order of the elements does not matter. When the datastore returns a cell array with more than three elements, the evaluateObjectDetection function assumes that the first element with an M-by-4 or M-by-5 numeric array contains the bounding boxes, the first element with categorical data contains the label data, and the first element with M-by-1 numeric data contains the scores.

    Overlap threshold for assigning a detection to a ground truth box, specified as a numeric scalar or numeric vector. The function calculates the overlap ratio as the intersection over union (IoU) of two boxes. When you specify a numeric vector, the evaluateObjectDetection function calculates metrics for each threshold.

    Name-Value Arguments

    Specify optional pairs of arguments as Name1=Value1,...,NameN=ValueN, where Name is the argument name and Value is the corresponding value. Name-value arguments must appear after other arguments, but the order of the pairs does not matter.

    Example: evaluateObjectDetection(__,AdditionalMetrics=["LAMR","AOS"]) additionally returns LAMR and AOS.

    Evaluation progress display toggle, specified as a numeric or logical 1 (true) or 0 (false). If you specify Verbose as true, the function displays progress information in the Command Window. The displayed information includes a progress bar, elapsed time, estimated time remaining, and data set metrics.

    Additional metrics, specified as "LAMR", "AOS", or a string array. The function returns the specified metrics as additional columns in the DatasetMetrics, ClassMetrics, and ImageMetrics tables of the metrics output, as shown in this table below. The confusion matrix and normalized confusion matrix are computed regardless of the value of AdditionalMetrics.

    AdditionalMetricsDatasetMetricsClassMetricsImageMetrics
    "LAMR"

    mLAMR: Mean of the log-average miss rate computed at all given thresholds, returned as a numeric scalar.

    LAMR: Log-average miss rate computed at each threshold as a numThresh-by-1 numeric vector, where numThresh is the number of overlap thresholds.

    mLAMR: Mean of the log-average miss rate of each class computed at all thresholds given.

    LAMR: Log-average miss rate for each class computed at each threshold as a numThresh-by-1 array.

    MR: Miss rate vector for a class as a numThresh-by-numPredictions matrix, where numPredictions is the number of predicted objects.

    FPPI: False positives per image vector for each class as a numThresh-by-numPredictions matrix.

    mLAMR: Mean of the log-average miss rate of each image computed at all given thresholds.

    LAMR: Log-average miss rate for an image computed at each threshold as a numThresh-by-1 array.

    "AOS"

    mAOS: Mean of the average orientation similarity computed at all the given thresholds.

    AOS: Average orientation similarity computed at each threshold as a numThresh-by-1 array.

    mAOS: Mean of average orientation similarity of a class computed at all the given thresholds.

    AOS: Average orientation similarity for a class computed at each threshold as a numThresh-by-1 array.

    OrientationSimilarity: Orientation similarity vector for each class, returned as a numThresh-by-(numPredictions+1) matrix.

    mAOS: Mean of average orientation similarity of each image computed at all the given thresholds.

    AOS: Average orientation similarity for each image computed at each threshold as a numThresh-by-1 array.

    To specify "AOS" as an additional metric, your input data must contain rotated bounding boxes.

    Output Arguments

    collapse all

    Object detection metrics, returned as an objectDetectionMetrics object. The OverlapThreshold property of the object corresponds to the value of the threshold argument.

    Version History

    Introduced in R2023b

    expand all