jmsam
ジェフリー・松下スペクトル角マッパー法を使用したスペクトルの類似度の評価
説明
Add-On Required: この機能にはが必要です。
score = jmsam(inputData,refSpectrum)inputData 内の各ピクセルのスペクトルと、指定した基準スペクトル refSpectrum の間のスペクトルの類似度を評価します。この構文を使用して、ハイパースペクトル データ キューブ内で異なる領域または物質を特定します。JMSAM 法の詳細については、詳細を参照してください。
score = jmsam(testSpectrum,refSpectrum)testSpectrum と基準スペクトル refSpectrum の間のスペクトルの類似度を評価します。この構文を使用して、未知の物質のスペクトル シグネチャを基準スペクトルと比較したり、2 つのスペクトル シグネチャ間のスペクトルのばらつきを計算したりします。
メモ
Hyperspectral Imaging Library for Image Processing Toolbox™ は、MATLAB® Online™ および MATLAB Mobile™ によってサポートされないため、デスクトップの MATLAB が必要です。
例
ハイパースペクトル データをワークスペースに読み取ります。
hcube = imhypercube("paviaU.dat");N-FINDR アルゴリズムを使用してデータ キューブから最初の 9 個のエンドメンバーのスペクトル シグネチャを抽出します。
numEndmembers = 9;
endmembers = nfindr(hcube,numEndmembers);
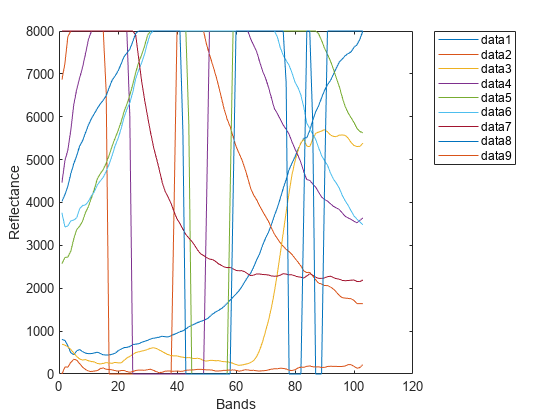
抽出したエンドメンバーのスペクトル シグネチャをプロットします。
figure
plot(endmembers)
xlabel("Bands")
ylabel("Reflectance")
legend(Location="Bestoutside")
各エンドメンバーとデータ キューブ内の各ピクセルのスペクトルの間で JM-SAM 距離を計算します。
datacube = gather(hcube);
score = zeros(size(datacube,1),size(datacube,2),numEndmembers);
for i = 1:numEndmembers
    score(:,:,i) = jmsam(hcube,endmembers(:,i));
end
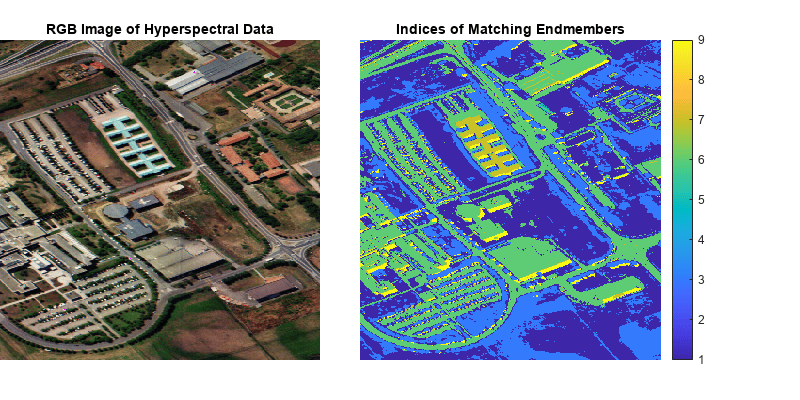
すべてのエンドメンバーについて、ピクセル スペクトルごとに取得した距離スコアから最小スコア値を計算します。それぞれの最小スコアのインデックスは、ピクセル スペクトルが最大の類似度を示すエンドメンバー スペクトルを識別します。スコア行列内の空間位置 (x, y) におけるインデックス値 n は、データ キューブ内の空間位置 (x, y) におけるピクセルのスペクトル シグネチャが、n 番目のエンドメンバーのスペクトル シグネチャに最適に一致することを示しています。
[~,matchingIdx] = min(score,[],3);
関数 colorize を使用して入力データの RGB イメージを推定します。
rgbImg = colorize(hcube,Method="rgb",ContrastStretching=true);RGB イメージおよび一致したインデックス値の行列の両方を表示します。
figure(Position=[0 0 800 400])
subplot(Position=[0 0.1 0.4 0.8])
imagesc(rgbImg)
axis off
title("RGB Image of Hyperspectral Data")
subplot(Position=[0.45 0.1 0.45 0.8])
imagesc(matchingIdx)
axis off
title("Indices of Matching Endmembers")
colorbar
ハイパースペクトル データをワークスペースに読み取ります。
hcube = imhypercube("indian_pines.dat");
datacube = gather(hcube);
ハイパースペクトル データの最初の 10 個のエンドメンバーを求めます。
numEndmembers = 10;
endmembers = nfindr(hcube,numEndmembers);
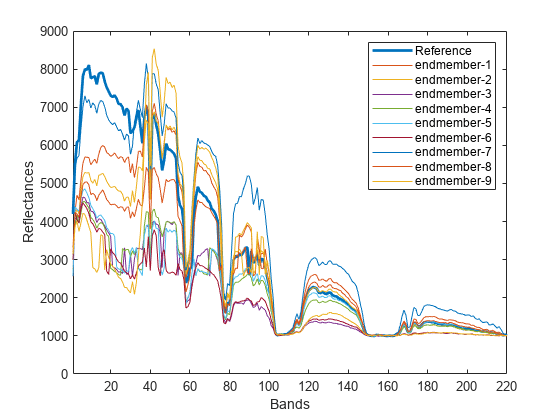
最初のエンドメンバーを基準スペクトル、残りのエンドメンバーをテスト スペクトルと見なします。
refSpectrum = endmembers(:,1);
testSpectra = endmembers(:,2:end);
基準スペクトルおよびその他のエンドメンバー スペクトルをプロットします。
plot(refSpectrum,LineWidth=2)
hold on
plot(testSpectra)
hold off
label(1) = "Reference";
for itr = 1:numEndmembers-1
    label(itr+1) = "endmember-"+itr;
end
xlabel("Bands")
ylabel("Reflectances")
legend(label)
xlim([1 size(datacube,3)]);
基準スペクトルと テスト スペクトル間の JM-SAM スコアを計算します。
score = zeros(1,numEndmembers-1);
for itr = 1:numEndmembers-1
    score(itr) = jmsam(testSpectra(:,itr),refSpectrum);
end
基準スペクトルに対して類似度が最大 (距離が最小) となるテスト スペクトルを求めます。次に、基準スペクトルに対して類似度が最小 (距離が最大) となるテスト スペクトルを求めます。
[minval,minidx] = min(score);
maxMatch = testSpectra(:,minidx);
[maxval,maxidx] = max(score);
minMatch = testSpectra(:,maxidx);
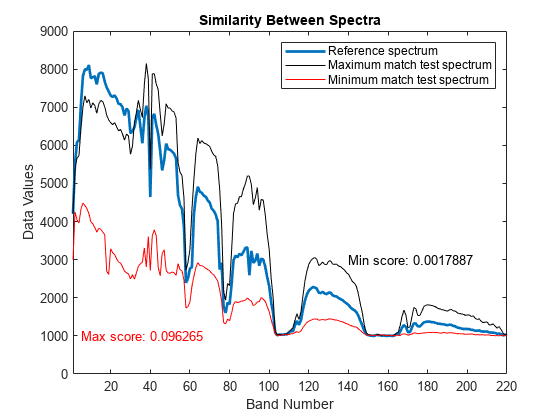
基準スペクトル、類似度が最大のテスト スペクトル、および最小のテスト スペクトルをプロットします。最小スコア値を持つテスト スペクトルは、基準エンドメンバーに対して最大の類似度を示します。一方、最大スコア値をもつテスト スペクトルはスペクトルのばらつきが最も大きく、2 つの異なる物質のスペクトル挙動の特徴を示しています。
figure
plot(refSpectrum,LineWidth=2)
hold on
plot(maxMatch,"k")
plot(minMatch,"r")
xlabel("Band Number")
ylabel("Data Values")
xlim([1 size(datacube,3)]);
legend("Reference spectrum","Maximum match test spectrum","Minimum match test spectrum")
title("Similarity Between Spectra")
text(5,1000,"Max score: "+maxval,Color="r")
text(140,3000,"Min score: "+minval,Color="k")
入力引数
出力引数
制限
この関数は、パフォーマンスが既に最適化されているため、parfor ループをサポートしません。 (R2023a 以降)
詳細
参照
[1] Padma, S., and S. Sanjeevi. “Jeffries Matusita Based Mixed-Measure for Improved Spectral Matching in Hyperspectral Image Analysis.” International Journal of Applied Earth Observation and Geoinformation 32 (October 2014): 138–51. https://doi.org/10.1016/j.jag.2014.04.001.
バージョン履歴
R2020b で導入
参考
spectralMatch | readEcostressSig | sid | hypercube | sidsam | ns3 | sam