readEcostressSig
ECOSTRESS スペクトル ライブラリからのデータの読み取り
構文
説明
Add-On Required: この機能にはが必要です。
例
ECOSTRESS スペクトル ライブラリから読み取るスペクトル ファイルの名前を、文字ベクトルの cell 配列として指定します。
ecostressfiles = [{'soil.utisol.hapludult.none.all.87p707.jhu.becknic.spectrum.txt'},...
             {'water.seawater.none.liquid.tir.seafoam.jhu.becknic.spectrum.txt'},...
             {'vegetation.tree.eucalyptus.maculata.vswir.jpl087.jpl.asd.spectrum.txt'},...
             {'manmade.road.tar.solid.all.0099uuutar.jhu.becknic.spectrum.txt'}];
指定した ECOSTRESS スペクトル ファイルからデータを読み取って表示します。この関数は指定したそれぞれの ECOSTRESS スペクトル ファイルを表す行を含む構造体配列を返します。各行には関連するファイルから読み取られたスペクトル データが格納されます。
libData = readEcostressSig(ecostressfiles)
libData=1×4 struct array with fields:
    Name
    Type
    Class
    SubClass
    ParticleSize
    Genus
    Species
    SampleNo
    Owner
    WavelengthRange
    Origin
    CollectionDate
    Description
    Measurement
    FirstColumn
    SecondColumn
    WavelengthUnit
    DataUnit
    FirstXValue
    LastXValue
    NumberOfXValues
    AdditionalInformation
    Wavelength
    Reflectance
      ⋮
構造体配列から、2 番目のファイルのスペクトル データの詳細を抽出します。
libData(2)
ans = struct with fields:
                     Name: "Sea Foam"
                     Type: "Water"
                    Class: "Sea Water"
                 SubClass: "none"
             ParticleSize: "Liquid"
                    Genus: [0×0 string]
                  Species: [0×0 string]
                 SampleNo: "seafoam"
                    Owner: "Dept. of Earth and Planetary Science, John Hopkins University"
          WavelengthRange: "TIR"
                   Origin: "JHU IR Spectroscopy Lab."
           CollectionDate: "N/A"
              Description: "Sea foam water. Original filename FOAM Original ASTER Spectral Library name was jhu.becknic.water.sea.none.liquid.seafoam.spectrum.txt"
              Measurement: "Directional (10 Degree) Hemispherical Reflectance"
              FirstColumn: "X"
             SecondColumn: "Y"
           WavelengthUnit: "micrometer"
                 DataUnit: "Reflectance (percent)"
              FirstXValue: "14.0112"
               LastXValue: "2.0795"
          NumberOfXValues: "2110"
    AdditionalInformation: "none"
               Wavelength: [2110×1 double]
              Reflectance: [2110×1 double]
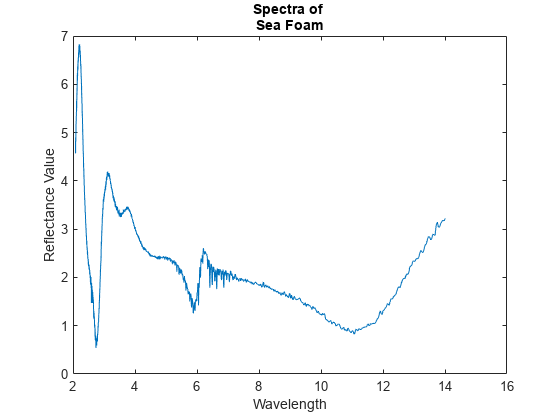
2 番目のファイルのスペクトル データから反射率と波長値を抽出します。
reflectance = libData(2).Reflectance;
wavelength = libData(2).Wavelength;
波長と反射率の値を使用してスペクトル シグネチャをプロットします。
figure
plot(wavelength,reflectance)
title(['Spectra of ' libData(2).Name])
xlabel('Wavelength')
ylabel('Reflectance Value')
ECOSTRESS スペクトル ファイルが含まれるディレクトリの絶対パスを指定します。
dirname = fullfile(matlabroot,'toolbox','images','supportpackages','hyperspectral','hyperdata','ECOSTRESSSpectraFiles');
ディレクトリ内のすべてのファイルからスペクトル データを読み取って表示します。この関数は指定したディレクトリ内にあるそれぞれの ECOSTRESS スペクトル ファイルを表す行を含む構造体配列を返します。
libData = readEcostressSig(dirname)
libData=1×15 struct array with fields:
    Name
    Type
    Class
    SubClass
    ParticleSize
    Genus
    Species
    SampleNo
    Owner
    WavelengthRange
    Origin
    CollectionDate
    Description
    Measurement
    FirstColumn
    SecondColumn
    WavelengthUnit
    DataUnit
    FirstXValue
    LastXValue
    NumberOfXValues
    AdditionalInformation
    Wavelength
    Reflectance
      ⋮
15 番目のファイルのスペクトル データの詳細を抽出します。
libData(15)
ans = struct with fields:
                     Name: "Tap water"
                     Type: "Water"
                    Class: "Tap Water"
                 SubClass: "none"
             ParticleSize: "Liquid"
                    Genus: [0×0 string]
                  Species: [0×0 string]
                 SampleNo: "tapwater"
                    Owner: "Dept. of Earth and Planetary Science, John Hopkins University"
          WavelengthRange: "All"
                   Origin: "JHU IR Spectroscopy Lab. Original filename TAPWATER."
           CollectionDate: "N/A"
              Description: "Tap water. Original ASTER Spectral Library name was jhu.becknic.water.tap.none.liquid.tapwater.spectrum.txt"
              Measurement: "Directional (10 Degree) Hemispherical Reflectance"
              FirstColumn: "X"
             SecondColumn: "Y"
           WavelengthUnit: "micrometer"
                 DataUnit: "Reflectance (percent)"
              FirstXValue: "14.0110"
               LastXValue: "0.4000"
          NumberOfXValues: "2844"
    AdditionalInformation: "none"
               Wavelength: [2844×1 double]
              Reflectance: [2844×1 double]
ECOSTRESS スペクトル ファイルが含まれるディレクトリの絶対パスを指定します。
dirname = fullfile(matlabroot,'toolbox','images','supportpackages','hyperspectral','hyperdata','ECOSTRESSSpectraFiles');
ECOSTRESS スペクトル ファイルのうち、特定のキーワードをファイル名に含むファイルからスペクトル データを読み取って表示します。この関数は、指定したディレクトリ内にあるスペクトル ファイルのうち、キーワードをファイル名に含むファイルのそれぞれを表す行を含む構造体配列を返します。
keyword = 'water';
libData = readEcostressSig(dirname,keyword)libData=1×3 struct array with fields:
Name
Type
Class
SubClass
ParticleSize
Genus
Species
SampleNo
Owner
WavelengthRange
Origin
CollectionDate
Description
Measurement
FirstColumn
SecondColumn
WavelengthUnit
DataUnit
FirstXValue
LastXValue
NumberOfXValues
AdditionalInformation
Wavelength
Reflectance
⋮
入力引数
出力引数
参照
[1] Meerdink, Susan K., Simon J. Hook, Dar A. Roberts, and Elsa A. Abbott. “The ECOSTRESS Spectral Library Version 1.0.” Remote Sensing of Environment 230 (September 2019): 111196. https://doi.org/10.1016/j.rse.2019.05.015.
[2] Download the ECOSTRESS Spectral Library: https://speclib.jpl.nasa.gov/download
バージョン履歴
R2020a で導入
参考
spectralMatch | sam | sid | hypercube