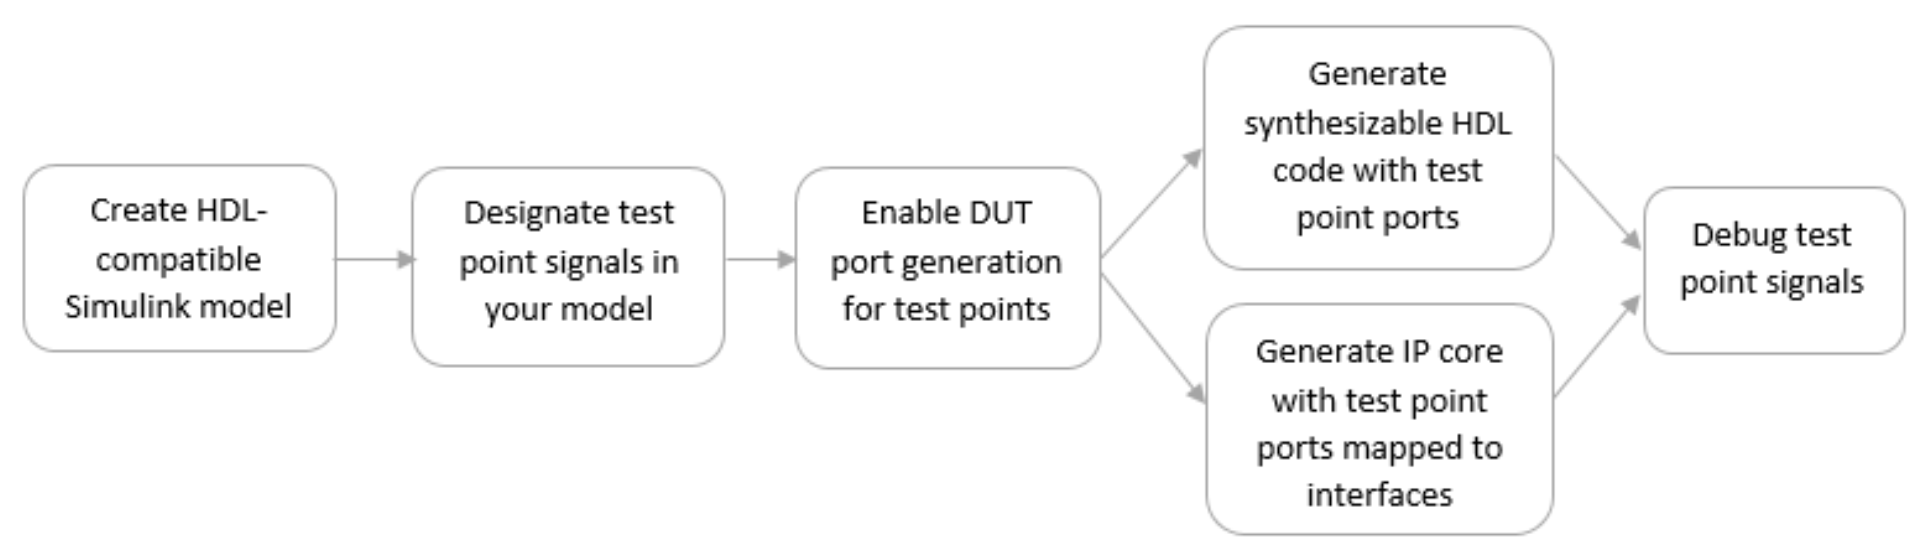
Model and Debug Test Point Signals with HDL Coder
This example shows how you can mark signals as test points in your Simulink® model and, after HDL code generation, debug the signals at the top level using the generated model or a test bench.
Why Use Test Points?
Test points are signals that you can use to easily debug and observe the simulation results at various points in your Simulink model. You can observe signals designated as test points with a Floating Scope block in a model. In Simulink, you can designate any signal in a model as a test point.
After code generation, you can observe test point signals at the DUT output ports and further debug the generated code in downstream workflows. This capability makes debugging your design easier because the code generator can propagate test point signals deep within the subsystem hierarchy to the DUT output ports.
Model and Debug Test Point Signals with HDL Coder
Create HDL-Compatible Model
Before you designate signals as test points and generate HDL code, make sure that the model you create is compatible for HDL code generation. See Create HDL-Compatible Simulink Model.
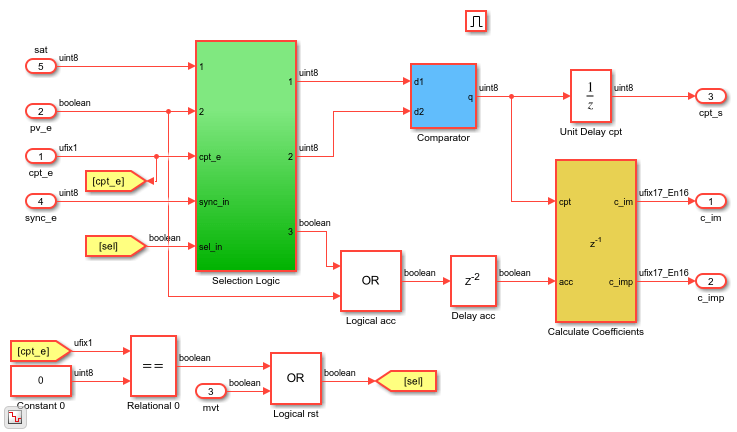
For this example, open the hdlcoder_test_points model that has been prepared for HDL code generation. The DUT is an Enabled Subsystem that calculates two coefficients based on inputs from a Selection Logic and a Comparator.
load_system('hdlcoder_test_points')
open_system('hdlcoder_test_points/DUT/MaJ Counter')
set_param('hdlcoder_test_points', 'SimulationCommand', 'update');
Designate Signals as Test Points
To debug internal signals in this model, mark them as test points in either of these ways:
In the Simulink Editor, to open the Signal Properties dialog box, right-click the signal, and select Properties. Then, select Test Point.
At the command line, get the handle to the output port of a block, and then set the port parameter
TestPointtoon.
For example, enter these commands to designate the output signal from the Logical acc block that performs the OR operation as a test point.
portHandles = get_param('hdlcoder_test_points/DUT/MaJ Counter/Logical acc', 'portHandles');
outportHandle = portHandles.Outport;
set_param(outportHandle,'TestPoint','on');
If a block has more than one output port, specify the outport handle that you want to designate as testpoint. For example, to designate the second output of a Demux block as a test point, enter this command:
set_param(outportHandle(2),'TestPoint','on');
Simulink displays an indicator on each signal for which you enable the Test point setting. If you navigate the model, you see three additional test points. These test points are inside the Selection Logic subsystem, the Comparator Subsystem, and the Calculate Coefficients Subsystem blocks.
To learn more, see Configure Signals as Test Points.
Enable DUT Output Port Generation for Test Points
Before you generate HDL code, to debug signals that are designated as test points, enable HDL DUT port generation for the signals. When you generate code for the model, HDL Coder™ propagates these signals to the DUT as an additional output port.
To enable DUT output port generation for the hdlcoder_simulink_test_points model:
In the Configuration Parameters dialog box, on the HDL Code Generation > Global Settings > Ports tab, select Enable HDL DUT port generation for test points.
At the command line, use the
EnableTestpointsproperty.
hdlset_param('hdlcoder_test_points','EnableTestpoints','on')
To learn more about this parameter, see Enable HDL DUT output port generation for test points.
When you enable DUT output port generation for test points, you can disable delay balancing for the generated DUT output ports by using the Configuration Parameters dialog box and disabling Balance delays for generated DUT output ports or by using the command line and setting BalanceDelaysForTestpoints to off. To learn more about this parameter, see Balance delays for generated DUT output ports.
You can also treat a manually added output port as a test point and disable the HDL block property BalanceDelays on the DUT-level Outport block.
After you enable DUT port generation, you can run either of these workflows:
Generate HDL code. To deploy the code onto a target FPGA, use the
Generic ASIC/FPGAworkflow in the HDL Workflow Advisor.Map test point ports to target platform interfaces, and generate an HDL IP core by using the
IP Core GenerationorSimulink Real-Time FPGA I/Oworkflows that useXilinx VivadoorAltera Quartus IIas the synthesis tools.
HDL Code Generation and FPGA Targeting
If you want to see the mapping between test point ports in the HDL code and the test point signals in your model, enable generation of the code generation report. The report displays the test point ports with links to the corresponding test point signals in your Simulink model.
For example, to enable report generation for the hdlcoder_simulink_test_points model:
In the Configuration Parameters dialog box, on the HDL Code Generation pane, select Generate resource utilization report.
To specify this setting at the command line, use the
ResourceReportproperty.
hdlset_param('hdlcoder_test_points','ResourceReport','on')
To learn more about report generation, see Create and Use Code Generation Reports.
To generate HDL code:
Right-click the
DUTsubsystem. To add the HDL Coder app options to the context menu, point to Select Apps and click HDL Coder. Then, in the HDL Coder app section, select Generate HDL for Subsystem.At the command line, run
makehdlon the DUT Subsystem.
To deploy the code onto a target platform, use the Generic ASIC/FPGA workflow. In the HDL Workflow Advisor, on the Set Target Device and Synthesis Tool task, for Target workflow, select Generic ASIC/FPGA, specify the Synthesis tool, and then run the workflow.
When generating code, HDL Coder opens the Code Generation report. The Code Interface Report section contains links to the test point ports in the Output Ports section.

When you click the links in the test point ports, the code generator highlights the corresponding signals that you designated as test points in your Simulink model. Therefore, you can use the report to trace back from the test point port in the generated code to the test point signals in your Simulink model.
To see the test point ports in the generated HDL code, open the DUT.v file.

You can see the test point ports at the top level module declaration. These ports have the prefix tp_ and a comment to indicate that they correspond to test point ports. If you specify VHDL® as the target language, you can see the test point ports in the entity declaration.
IP Core Generation and SoC Targeting
To generate an HDL IP core, open the HDL Workflow Advisor. In the Advisor:
On the Set Target Device and Synthesis Tool task, for Target workflow, select
IP Core Generation, and specify a Target platform that usesXilinx VivadoorAltera Quartus IIas the Synthesis tool. If you use theSimulink Real-Time FPGA I/Oworkflow, specify a Target platform that usesXilinx Vivadoas the Synthesis toolOn the Set Target Reference Design task, you can specify the HDL Coder default reference designs, or a custom reference design that you want to integrate the HDL IP core into. If you do not specify unique names for test point signals, running this task can fail. To fix this error, in the Result subpane, select the link to generate unique names for test point signals. To verify that the task passes, rerun the task.
On the Set Target Interface task, you can enable HDL DUT port generation for testpoints by selecting the Enable HDL DUT port generation for testpoints checkbox and see the test point ports in the Target platform interface table. You can map the ports to AXI4, AXI4-Lite, or External Port interfaces. After you run this task, the code generator stores this testpoint interface mapping information on the DUT. To see this information, in the HDL Block Properties for the DUT Subsystem, on the Target Specification tab, look for the TestPointMapping block property. You can reload this information for the DUT across subsequent runs of the workflow.
On the Generate RTL Code and IP Core task, right-click and select Run to Selected Task to generate the IP core. The code generator opens an IP Core Generation report that displays the mapping of test point ports to interfaces.

When you click the links in the test point ports, the code generator highlights the corresponding signals that you designated as test points in your Simulink model.
If you open the generated HDL source file, you see the test point signals connected to the IP core wrapper.

Run the workflow to generate the Software Interface model and integrate the IP core into the target reference design that you specified in the Set Target Reference Design task.
To learn more about the IP Core Generation workflow, see Custom IP Core Generation and Custom IP Core Report.
Debug Test Point Signals
After you generate HDL code or generate an IP core, you can debug the test point signals.
If you generated HDL code for your model or ran the Generic ASIC/FPGA workflow, to debug the test point signals, generate a HDL test bench, or use the generated model. To open the generated model, at the command line, enter gm_hdlcoder_test_points.

In the generated model, you see the test points at the DUT output ports connected to a Scope block that is commented out. To observe the simulation results for these signals, uncomment the Scope block, and then run the simulation. If you navigate the generated model, you can see that the code generator creates an output port at the point where you designated the signal as a test point. HDL Coder then propagates these ports to the DUT as additional output ports.
If you run the IP Core Generation workflow to the Generate Software Interface Model task, the code generator opens the Software Interface model.

To observe the data on test point signals from the ARM® processor, uncomment the Scope block, and then run the Software Interface model.
Considerations
Test point ports are considered similar to other output ports in the code generation process. Test point port generation works with all optimizations such as resource sharing, streaming, and distributed pipelining. To learn about various optimizations, see Speed and Area Optimization.
If you generate a validation model, you see that the code generator does not compare the test point signals with the test point ports at the output. You can still observe the test point signals by uncommenting the Scope block and by running the simulation. To learn more about generated model and validation model, see Generated Model and Validation Model.
If you generate a cosimulation model, you see the test point ports connected to a Terminator block. To observe the test points, remove the Terminator blocks, and connect the output ports to a Scope block, and then run cosimulation. You can also observe the waveforms in the HDL simulator that you run cosimulation with. To learn more about cosimulation, see Generate Cosimulation Model.
If you open the generated model, you see the Scope block commented out for performance considerations.
You cannot specify the port ordering for the DUT test point ports. HDL Coder determines the port ordering when you generate code.
Target workflow must be
Generic ASIC/FPGA,IP Core Generation, orSimulink Real-Time FPGA I/O.If you use
IP Core GenerationorSimulink Real-Time FPGA I/Oworkflows, the Synthesis tool must beXilinx VivadoorAltera Quartus II.Xilinx ISEis not supported.If you use
IP Core GenerationorSimulink Real-Time FPGA I/Oworkflows, you map the test point ports to AXI4, AXI4-Lite, or External Port interfaces. You cannot map the ports to AXI4-Stream or AXI4-Stream Video interfaces.When you use test point or tunable parameters in the IP core workflow, the DUT must be a subsystem level DUT and not the top-level model or model reference DUT.