Isolation Forest Anomaly Detector
Libraries:
Statistics and Machine Learning Toolbox /
Anomaly Detection
Description
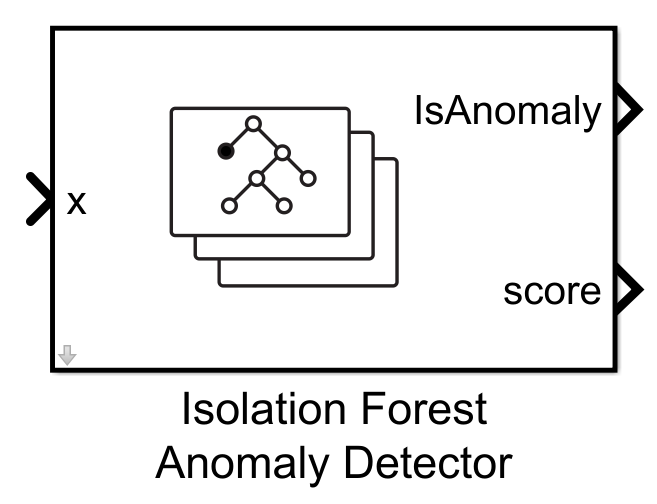
The Isolation Forest Anomaly Detector block finds anomalies in data using a trained isolation forest model object.
Import an initialized isolation forest model object (IsolationForest) into
the block by specifying the name of a workspace variable that contains the object. The input
port x receives a data stream for which anomalies are evaluated. The
output port IsAnomaly returns values indicating if anomalies are
detected, and the output port score returns the anomaly scores.
Examples
Train an isolation forest model for anomaly detection using the iforest function. Then detect anomalies in new data by passing the new data to the Isolation Forest Anomaly Detector block.
Load the sample data set NYCHousing2015.
load NYCHousing2015The data set includes 10 variables with information on the sales of properties in New York City in 2015. Remove the NEIGHBORHOOD variable, which has 254 categories, and the BUILDINGCLASSCATEGORY variable, which is not numeric.
NYCHousing2015.NEIGHBORHOOD = [];
NYCHousing2015.BUILDINGCLASSCATEGORY = [];
The SALEDATE variable is a datetime array, which is not supported by iforest. Create variables for the month and day numbers of the datetime values, and then delete the SALEDATE variable.
[~,NYCHousing2015.MM,NYCHousing2015.DD] = ymd(NYCHousing2015.SALEDATE);
NYCHousing2015.SALEDATE = [];
Shuffle the order of the observations and convert the table into a matrix.
rng(0,"twister") % For reproducibility
NYCHousing2015 = NYCHousing2015(randperm(height(NYCHousing2015)),:);
NYCHousing2015 = table2array(NYCHousing2015);
Create a training data set using the first 40,000 observations, and a test data set using the next 5000 observations.
n_train = 40000;
n_test = 5000;
X_train = NYCHousing2015(1:n_train,:);
X_test = NYCHousing2015(n_train+1:n_train+n_test,:);
Train an isolation forest model using the training data. Assume that the outlier fraction in the training data is 0.5%. Because the first variable (BOROUGH) is not ordinal, treat it as categorical.
[ifMdl,tf,scores_train] = iforest(X_train,ContaminationFraction=0.005,CategoricalPredictors=1);
ifMdl is an IsolationForest model object. The iforest function also returns the anomaly indicators tf and anomaly scores scores_train for the training data.
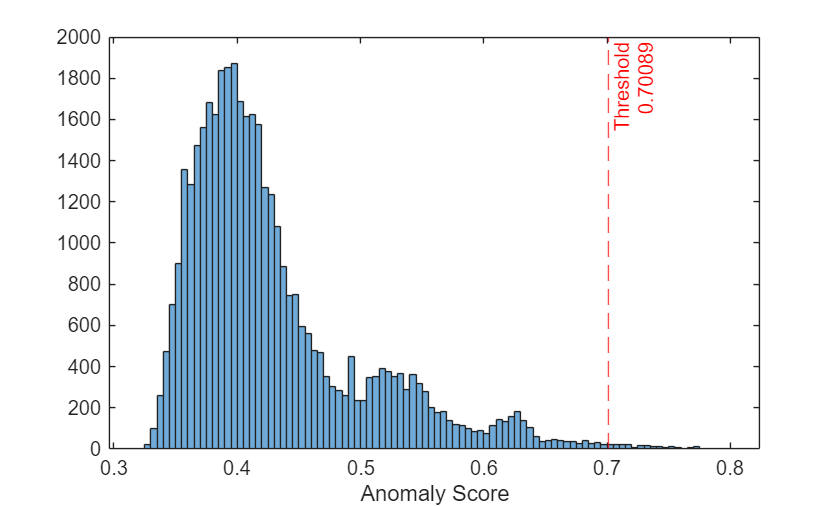
Plot a histogram of the anomaly score values. Create a vertical dashed line at the score threshold corresponding to the specified outlier fraction.
histogram(scores_train)
xlabel("Anomaly Score")
xline(ifMdl.ScoreThreshold,"r--",["Threshold" ifMdl.ScoreThreshold])
Convert the test data into a time series object to load into the Simulink model.
t = 0:size(X_test,1)-1;
X_ts = timeseries(X_test,t,InterpretSingleRowDataAs3D=true);
This example provides the Simulink model slexIFAnomalyDetector.slx, shown in the figure below. The model is configured to use ifMdl as the initial model for the Isolation Forest Anomaly Detector block. You can double-click the block to access the Block Parameters dialog box.
slName = "slexIFAnomalyDetector";
open_system(slName);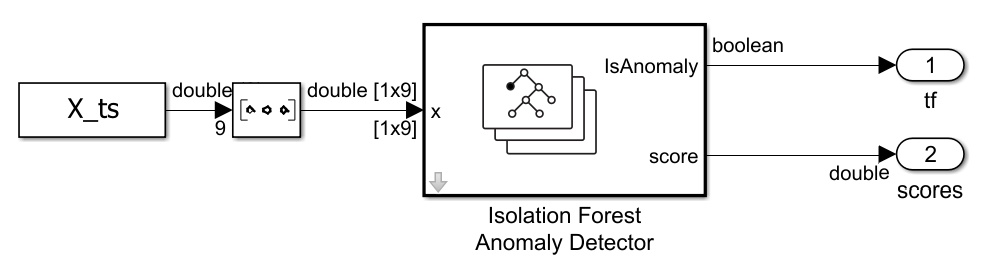
Simulate the Simulink model to perform anomaly detection on the test data. At each iteration, the Isolation Forest Anomaly Detector block flags an observation as an anomaly if its anomaly score is above the threshold.
simOut = sim(slName,"StopTime",num2str(numel(t)-1));Export the simulation outputs to the workspace. You can use the Simulation Data Inspector (Simulink) to view the logged data of an Outport block.
% Extract IsAnomaly values
IsAnomaly_sig = simOut.yout.getElement(1);
IsAnomaly_sl = squeeze(IsAnomaly_sig.Values.Data);

% Extract score values
score_sig = simOut.yout.getElement(2);
score_sl = squeeze(score_sig.Values.Data);
Plot the anomaly scores and indicate the anomalous observations with red circle markers. Create a dashed line at the score threshold.
figure
plot(score_sl,".")
ylabel("Anomaly Score")
xlabel("Observation Number")
hold on
idx = find(IsAnomaly_sl == 1);
plot(idx,score_sl(idx),"ro")
yline(ifMdl.ScoreThreshold,"r--")
hold off
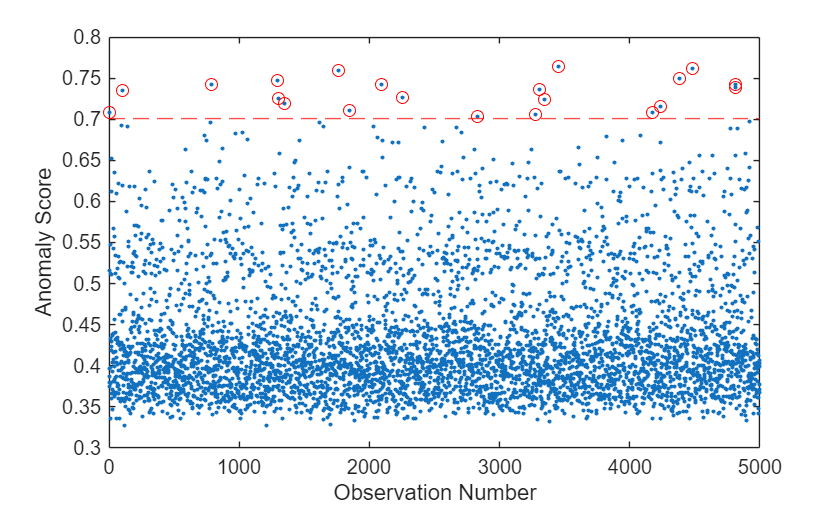
Compute the fraction of anomalous observations in the test data set.
frac = sum(IsAnomaly_sl/n_test)
frac =
0.0042
The anomaly fraction (0.4%) is similar to the anomaly fraction in the training data set.
Ports
Input
Output
Parameters
Main
Specify the name of a workspace variable that contains an IsolationForest model object.
Programmatic Use
Block Parameter:
AnomalyLearner |
| Type: workspace variable |
Values:
IsolationForest object |
Default:
"anomalyMdl" |
Specify the threshold for the anomaly score. If an observation has an anomaly score above the threshold, the software identifies the observation as an anomaly.
Programmatic Use
Block Parameter: ScoreThreshold |
| Type: character vector or string |
Values: "[]" | numeric scalar |
Default: "[]" |
Specify the discrete interval between sample time hits or specify another type of sample
time, such as continuous (0) or inherited (–1). For more
options, see Types of Sample Time (Simulink).
By default, the Isolation Forest Anomaly Detector block inherits sample time based on the context of the block within the model.
Programmatic Use
Block Parameter:
SystemSampleTime |
| Type: string scalar or character vector |
| Values: scalar |
Default:
"–1" |
Data Types
Fixed-Point Operational Parameters
Data Type
Specify the data type for the score output. The type can be
inherited, specified directly, or expressed as a data type object such as
Simulink.NumericType.
When you select Inherit: auto, the block uses a rule
that inherits a data
type.
For more information about data types, see Control Data Types of Signals (Simulink).
Click the Show data type
assistant button ![]() to display the Data Type
Assistant, which helps you set the data type attributes. For more
information, see Specify Data Types Using Data Type Assistant (Simulink).
to display the Data Type
Assistant, which helps you set the data type attributes. For more
information, see Specify Data Types Using Data Type Assistant (Simulink).
Programmatic Use
Block Parameter:
ScoreDataTypeStr |
| Type: character vector or string |
Values: "Inherit: auto"
| "double" | "single" |
"half" | "int8" |
"uint8" | "int16" |
"uint16" | "int32" |
"uint32" | "int64" |
"uint64" | "fixdt(1,16,0)" |
"fixdt(1,16,2^0,0)" | "<data type
expression>" |
Default: "Inherit:
auto" |
Specify the lower value of the score output range that Simulink® checks.
Simulink uses the minimum value to perform:
Parameter range checking for some blocks (see Specify Minimum and Maximum Values for Block Parameters (Simulink)).
Simulation range checking (see Specify Signal Ranges (Simulink) and Enable Simulation Range Checking (Simulink)).
Optimization of the code that you generate from the model. This optimization can remove algorithmic code and affect the results of some simulation modes, such as software-in-the-loop (SIL) mode or external mode. For more information, see Optimize using the specified minimum and maximum values (Embedded Coder).
Note
The Score data type Minimum parameter does not saturate or clip the actual score output. To do so, use the Saturation (Simulink) block instead.
Programmatic Use
Block Parameter:
ScoreOutMin |
| Type: character vector |
Values: "[]" |
scalar |
Default: "[]" |
Specify the upper value of the score output range that Simulink checks.
Simulink uses the maximum value to perform:
Parameter range checking for some blocks (see Specify Minimum and Maximum Values for Block Parameters (Simulink)).
Simulation range checking (see Specify Signal Ranges (Simulink) and Enable Simulation Range Checking (Simulink)).
Optimization of the code that you generate from the model. This optimization can remove algorithmic code and affect the results of some simulation modes, such as SIL or external mode. For more information, see Optimize using the specified minimum and maximum values (Embedded Coder).
Note
The Score data type Maximum parameter does not saturate or clip the actual score output. To do so, use the Saturation (Simulink) block instead.
Programmatic Use
Block Parameter:
ScoreOutMax |
| Type: character vector |
Values: "[]" |
scalar |
Default: "[]" |
Specify the data type of the adjusted tree depth. The type can be inherited,
specified directly, or expressed as a data type object such as
Simulink.NumericType.
For more information about data types, see Control Data Types of Signals (Simulink).
Click the Show data type
assistant button ![]() to display the Data Type
Assistant, which helps you set the data type attributes. For more
information, see Specify Data Types Using Data Type Assistant (Simulink).
to display the Data Type
Assistant, which helps you set the data type attributes. For more
information, see Specify Data Types Using Data Type Assistant (Simulink).
Programmatic Use
Block Parameter:
TreeDepthDataTypeStr |
| Type: character vector or string |
Values: "Inherit: auto"
| "double" | "single" |
"half" | "int8" |
"uint8" | "int16" |
"uint16" | "int32" |
"uint32" | "int64" |
"uint64" | "fixdt(1,16,0)" |
"fixdt(1,16,2^0,0)" | "<data type
expression>" |
Default: "Inherit: auto"
|
Specify the lower value of the adjusted tree depth range that Simulink checks.
Simulink uses the minimum value to perform:
Parameter range checking for some blocks (see Specify Minimum and Maximum Values for Block Parameters (Simulink)).
Simulation range checking (see Specify Signal Ranges (Simulink) and Enable Simulation Range Checking (Simulink)).
Optimization of the code that you generate from the model. This optimization can remove algorithmic code and affect the results of some simulation modes, such as software-in-the-loop (SIL) mode or external mode. For more information, see Optimize using the specified minimum and maximum values (Embedded Coder).
Note
The Adjusted tree depth data type Minimum parameter does not saturate or clip the actual adjusted tree depth value.
Programmatic Use
Block Parameter:
TreeDepthOutMin |
| Type: character vector |
Values: '[]' |
scalar |
Default: '[]' |
Specify the upper value of the adjusted tree depth range that Simulink checks.
Simulink uses the maximum value to perform:
Parameter range checking for some blocks (see Specify Minimum and Maximum Values for Block Parameters (Simulink)).
Simulation range checking (see Specify Signal Ranges (Simulink) and Enable Simulation Range Checking (Simulink)).
Optimization of the code that you generate from the model. This optimization can remove algorithmic code and affect the results of some simulation modes, such as SIL or external mode. For more information, see Optimize using the specified minimum and maximum values (Embedded Coder).
Note
The Adjusted tree depth data type Maximum parameter does not saturate or clip the actual adjusted tree depth value.
Programmatic Use
Block Parameter:
TreeDepthOutMax |
| Type: character vector |
Values: '[]' |
scalar |
Default: '[]' |
Block Characteristics
Data Types |
|
Direct Feedthrough |
|
Multidimensional Signals |
|
Variable-Size Signals |
|
Zero-Crossing Detection |
|
Extended Capabilities
Version History
Introduced in R2026a