plotPermutationResults
構文
説明
plotPermutationResults( は、p 値が最も低い変数についての関数 DDiagnostics)driftdetect による並べ替え検定で計算されたメトリクス値のヒストグラムをプロットします。
detectdrift の呼び出しで EstimatePValues の値を false に設定した場合、plotPermutationResults はプロットを生成せず、代わりに警告を返します。
plotPermutationResults( は、DDiagnostics,Variable=variable)variable で指定された変数についてのヒストグラムをプロットします。
H = plotPermutationResults(___)Histogram オブジェクトの配列 H を返します。H はヒストグラムのプロパティを調べたり変更したりするために使用します。詳細については、Histogram のプロパティ を参照してください。
[ は、メトリクスのしきい値の H,CL] = plotPermutationResults(___)ConstantLine オブジェクト CL を追加で返します。CL はラインのプロパティを調べたり変更したりするために使用します。詳細については、ConstantLine のプロパティ を参照してください。
例
3 つの変数をもつベースライン データとターゲット データを生成します。ターゲット データで 2 つ目と 3 つ目の変数の分布パラメーターを変化させます。
rng('default') % For reproducibility
baseline = [normrnd(0,1,100,1),wblrnd(1.1,1,100,1),betarnd(1,2,100,1)];
target = [normrnd(0,1,100,1),wblrnd(1.2,2,100,1),betarnd(1.7,2.8,100,1)];
すべての変数についての並べ替え検定を実行して、ベースライン データとターゲット データの間のドリフトを調べます。
DDiagnostics = detectdrift(baseline,target)
DDiagnostics =
  DriftDiagnostics

              VariableNames: ["x1"    "x2"    "x3"]
       CategoricalVariables: []
                DriftStatus: ["Stable"    "Drift"    "Warning"]
                    PValues: [0.3850 0.0050 0.0910]
        ConfidenceIntervals: [2×3 double]
    MultipleTestDriftStatus: "Drift"
             DriftThreshold: 0.0500
           WarningThreshold: 0.1000


  Properties, Methods
既定の変数についての順列の結果をプロットします。
plotPermutationResults(DDiagnostics)
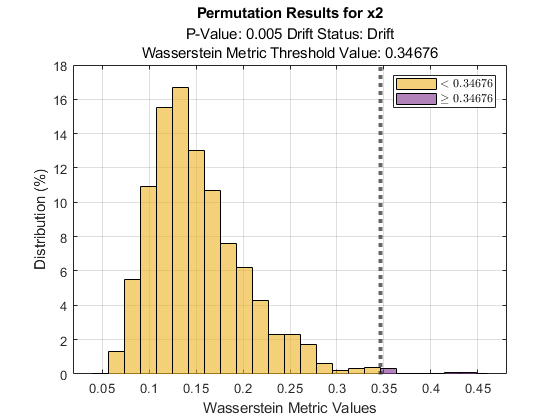
既定では、plotPermutationResults は、"p" 値が最も低い変数についての並べ替え検定で計算されたメトリクス値のヒストグラムをプロットします。この例では x2 です。ヒストグラムにはメトリクスのしきい値 (ベースライン データとターゲット データを使用して detectdrift で計算される初期メトリクス値) も含まれるため、しきい値以上の値を確認できます。また、plotPermutationResults では、変数の "p" 値とドリフト ステータス、detectdrift の呼び出しで並べ替え検定に使用するように指定したメトリクスも表示されます。この例ではメトリクスを指定していないため、連続変数に対する既定のメトリクス (ワッサースタイン) が detectdrift で使用されます。
3 つの変数をもつベースライン データとターゲット データを生成します。ターゲット データで 2 つ目と 3 つ目の変数の分布パラメーターを変化させます。
rng('default') % For reproducibility
baseline = [normrnd(0,1,100,1),wblrnd(1.1,1,100,1),betarnd(1,2,100,1)];
target = [normrnd(0,1,100,1),wblrnd(1.2,2,100,1),betarnd(1.7,2.8,100,1)];
すべての変数についての並べ替え検定を実行して、ベースライン データとターゲット データの間のドリフトを調べます。すべての変数にエネルギー メトリクスを使用します。
DDiagnostics = detectdrift(baseline,target,ContinuousMetric="energy")DDiagnostics =
DriftDiagnostics
VariableNames: ["x1" "x2" "x3"]
CategoricalVariables: []
DriftStatus: ["Stable" "Drift" "Warning"]
PValues: [0.3790 0.0110 0.0820]
ConfidenceIntervals: [2×3 double]
MultipleTestDriftStatus: "Drift"
DriftThreshold: 0.0500
WarningThreshold: 0.1000
Properties, Methods
"p" 値の 95% 信頼限界を表示します。
DDiagnostics.ConfidenceIntervals
ans = 2×3

    0.3488    0.0055    0.0657
    0.4099    0.0196    0.1008
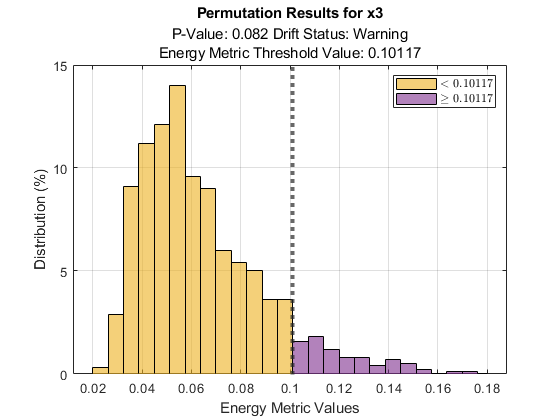
3 つ目の変数についての順列の結果をプロットします。
plotPermutationResults(DDiagnostics,Variable=3)

3 つの変数をもつベースライン データとターゲット データを生成します。ターゲット データで 2 つ目と 3 つ目の変数の分布パラメーターを変化させます。
rng('default') % For reproducibility
baseline = [normrnd(0,1,100,1),wblrnd(1.1,1,100,1),betarnd(1,2,100,1)];
target = [normrnd(0,1,100,1),wblrnd(1.2,2,100,1),betarnd(1.7,2.8,100,1)];
すべての変数についての並べ替え検定を実行して、ベースライン データとターゲット データの間のドリフトを調べます。すべての変数にエネルギー メトリクスを使用します。
DDiagnostics = detectdrift(baseline,target,ContinuousMetric="energy")DDiagnostics =
DriftDiagnostics
VariableNames: ["x1" "x2" "x3"]
CategoricalVariables: []
DriftStatus: ["Stable" "Drift" "Warning"]
PValues: [0.3790 0.0110 0.0820]
ConfidenceIntervals: [2×3 double]
MultipleTestDriftStatus: "Drift"
DriftThreshold: 0.0500
WarningThreshold: 0.1000
Properties, Methods
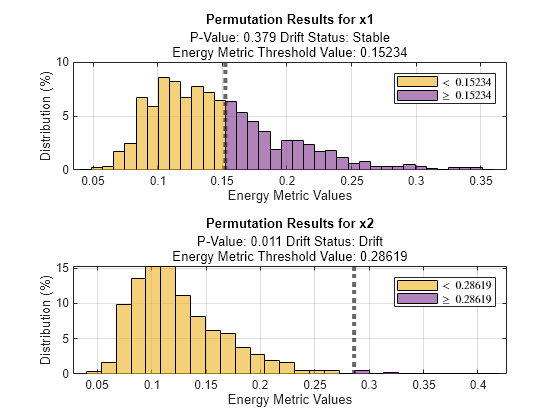
変数 x1 と x2 についての順列の結果をタイル レイアウトでプロットします。
tiledlayout(2,1);
ax1 = nexttile;
plotPermutationResults(DDiagnostics,ax1,Variable="x1")
ax2 = nexttile;
plotPermutationResults(DDiagnostics,ax2,Variable="x2")
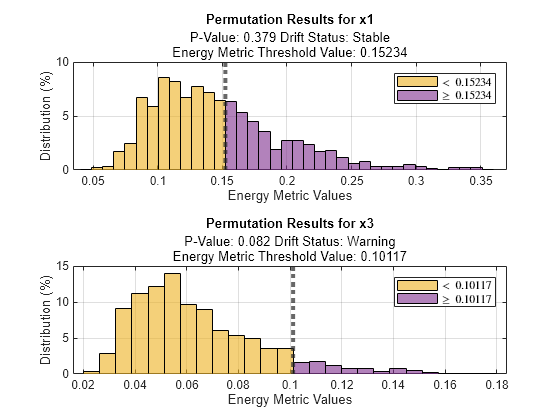
変数 x1 と x3 についての順列の結果をタイル レイアウトでプロットします。
tiledlayout(2,1);
ax1 = nexttile;
plotPermutationResults(DDiagnostics,ax1,Variable="x1")
ax3= nexttile;
plotPermutationResults(DDiagnostics,ax3,Variable="x3")
3 つの変数をもつベースライン データとターゲット データを生成します。ターゲット データで 2 つ目と 3 つ目の変数の分布パラメーターを変化させます。
rng('default') % For reproducibility
baseline = [normrnd(0,1,100,1),wblrnd(1.1,1,100,1),betarnd(1,2,100,1)];
target = [normrnd(0,1,100,1),wblrnd(1.2,2,100,1),betarnd(1.7,2.8,100,1)];
すべての変数についての並べ替え検定を実行して、ベースライン データとターゲット データの間のドリフトを調べます。エネルギー距離をメトリクスとして使用します。
DDiagnostics = detectdrift(baseline,target,ContinuousMetric="energy")DDiagnostics =
DriftDiagnostics
VariableNames: ["x1" "x2" "x3"]
CategoricalVariables: []
DriftStatus: ["Stable" "Drift" "Warning"]
PValues: [0.3790 0.0110 0.0820]
ConfidenceIntervals: [2×3 double]
MultipleTestDriftStatus: "Drift"
DriftThreshold: 0.0500
WarningThreshold: 0.1000
Properties, Methods
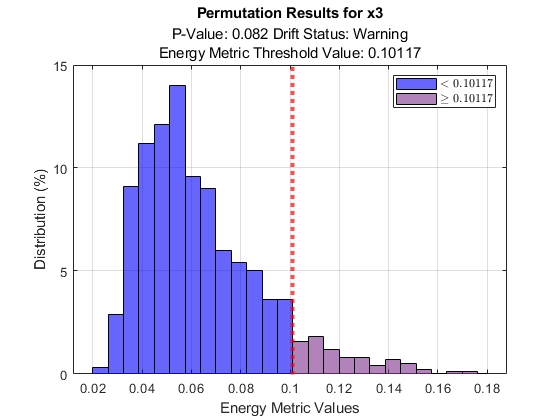
3 つ目の変数についての順列の結果をプロットします。
[H,CL] = plotPermutationResults(DDiagnostics,Variable=3)
H =
  2×1 Histogram array:

  Histogram
  Histogram
CL =
  ConstantLine with properties:

    InterceptAxis: 'x'
            Value: 0.1012
            Color: [0.1500 0.1500 0.1500]
        LineStyle: ':'
        LineWidth: 3
            Label: ''
      DisplayName: ''

  Show all properties
ヒストグラムのバーの色を青、しきい値のラインの色を赤に変更します。
H(1).FaceColor = "b";
CL.Color = "r";
Workspace で H または CL をダブルクリックして Property Inspector を開き、それを使用してプロパティにアクセスして変更することもできます。
入力引数
出力引数
バージョン履歴
R2022a で導入
参考
detectdrift | DriftDiagnostics | plotDriftStatus | plotEmpiricalCDF | plotHistogram | ecdf | summary | histcounts