Distribution Fitter
Fit probability distributions to data
Description
The Distribution Fitter app interactively fits probability distributions to data imported from the MATLAB® workspace. You can choose from 22 built-in probability distributions or create your own custom distribution. The app displays plots of the fitted distribution superimposed on a histogram of the data. Available plots include probability density function (pdf), cumulative distribution function (cdf), probability plots, and survivor functions. You can export the fitted parameter values to the workspace as a probability distribution object, and use object functions to perform further analyses. For more information on working with these objects, see Working with Probability Distributions. For the programmatic work flow of the Distribution Fitter app, see Programmatic Use.
Required Products
MATLAB
Statistics and Machine Learning Toolbox™

Open the Distribution Fitter App
MATLAB Toolstrip: On the Apps tab, under Math, Statistics and Optimization, click the app icon.
MATLAB command prompt: Enter
distributionFitter
.
Examples
Load the carsmall
sample data.
load carsmall
Open the Distribution Fitter app using the MPG
miles per gallon data.
distributionFitter(MPG)
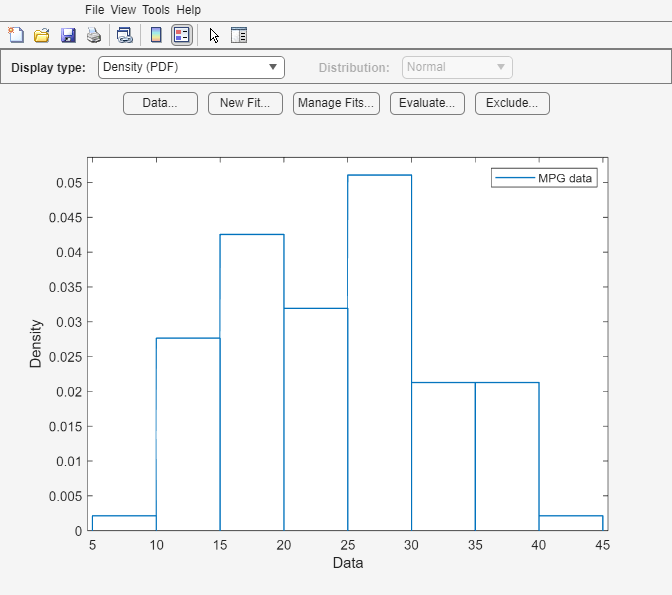
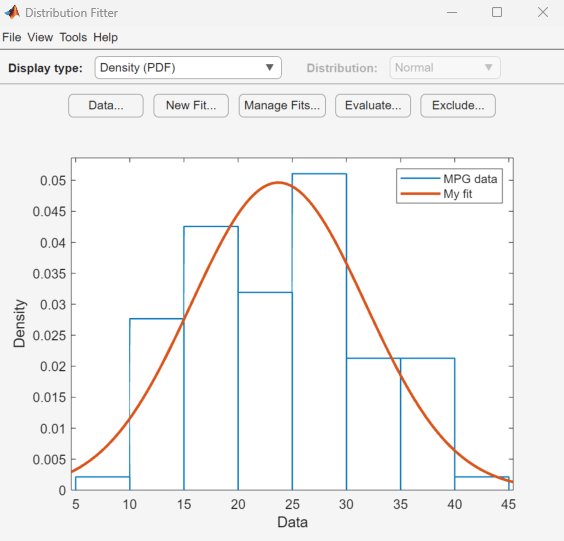
The Distribution Fitter app opens, populated with the MPG
data, and displays the density (PDF) plot. You can use the app to display different plots and fit distributions to this data.
Load the sample data.
load lightbulb.mat
The first column of the data contains the lifetime (in hours) of two types of light bulbs. The second column contains information about the type of light bulb. 1 indicates fluorescent bulbs, and 0 indicates the incandescent bulb. The third column contains censoring information. 1 indicates censored data, and 0 indicates the exact failure time. This is simulated data.
Open the Distribution Fitter app using the first column of lightbulb
as the input data, and the third column as the censoring data. Name the data lifetime
.
distributionFitter(lightbulb(:,1),lightbulb(:,3),[],"lifetime")
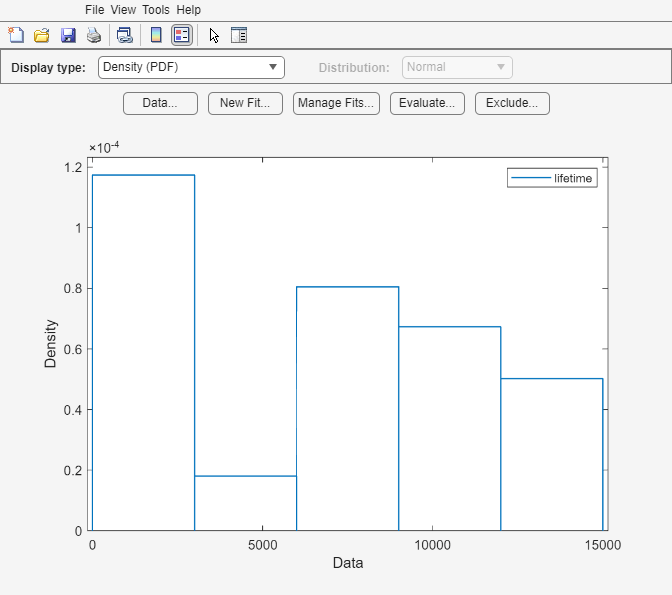
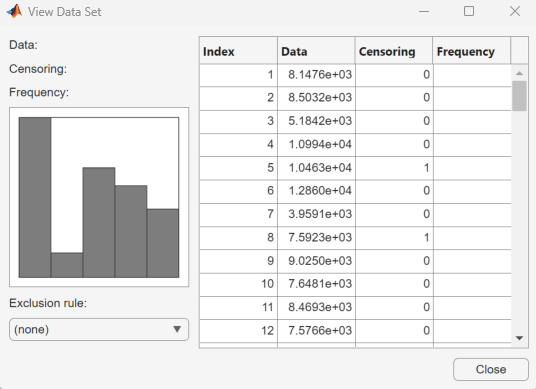
To open the Data dialog box, click Data. In the Manage data sets pane, click to highlight the lifetime
data set row. Finally, to open the View Data Set dialog box, click View. The lifetime data appears in the second column and the corresponding censoring indicator appears in the third column.
Related Examples
Parameters
Data
Specify the data to import by selecting a variable from the drop-down list. If the variable is a matrix, the app imports the first column of the matrix by default. To select a different column or row of the matrix, click Select Column or Row. Alternatively, you can enter any valid MATLAB expression in the field.
Specify the censoring data by selecting a variable from the drop-down list. If the variable is a matrix, the app imports the first column of the matrix by default. To select a different column or row of the matrix, click Select Column or Row. This parameter is optional.
Specify the frequency data by selecting a variable from the drop-down list. If the variable is a matrix, the app imports the first column of the matrix by default. To select a different column or row of the matrix, click Select Column or Row. This parameter is optional.
Enter a name for the data set or accept the default name.
Manage previously imported data sets. Click the data set of interest, then click the buttons below this pane to view the data (View), set the bin rules (Set Bin Rules), rename the data set (Rename), or delete the data set (Delete).
Display a preview plot of the variable selected from the Data drop-down menu.
New fit
Enter a name for the fit or accept the default name.
Specify the data to fit by selecting a data set from the drop-down list.
Specify the distribution to fit by selecting a distribution name from the drop-down list.
Specify a rule to exclude some data values by selecting an exclusion rule from the drop-down list. To populate this drop-down list, you must first define exclusion rules by clicking Exclude in the main window of the app. This parameter is optional
Manage fits
Specify which fit or fits to plot in the main window by selecting the Plot check box next to each fit. Clear the Plot check box to remove a fit from the plot.
If you select Plot for a particular fit, you can select Conf bounds to display the confidence bounds for that fit on the plot in the main window. Clearing the Conf bounds check box removes the confidence intervals from the plot. The Distribution Fitter app displays confidence bounds only if the Display Type in the main window is set to Cumulative probability (CDF), Quantile (inverse CDF), Survivor function, or Cumulative hazard.
Evaluate
Select one or more fits from the list to evaluate.
Specify the type of probability function to evaluate from the drop-down list. Available probability functions include the probability density function (pdf), cumulative distribution function (cdf), quantile (inverse cdf), survival function, cumulative hazard, and hazard rate.
Specify a numeric vector of values at which to evaluate the function. If you specify Function as Quantile (inverse CDF), this field name changes to At p = and you enter a vector of probability values.
Select Compute confidence bounds to compute the confidence bounds for the selected fit. This check box is enabled only if you specify Function as Cumulative probability (CDF), Quantile (inverse CDF), Survivor function, or Cumulative hazard. This parameter is optional.
Specify the level at which to compute the confidence bounds. This check box is enabled only if you specify Function as Cumulative probability (CDF), Quantile (inverse CDF), Survivor function, or Cumulative hazard.
Select Plot function to display a plot of the distribution function, evaluated at the points that you enter in the At x = field, in a new window. This parameter is optional.
Exclude
Enter a name for the exclusion rule.
Specify lower and upper limits for the data numerically.
Specify lower and upper limits for the data by selecting a variable from the Select data drop-down list and clicking Exclude Graphically. An interactive plot opens in a new window, where you can add lower or upper limits by clicking and dragging a boundary on the plot.
Select an existing exclusion rule from the list. You can copy, view, rename, or delete exclusion rules by clicking the appropriate button.
Programmatic Use
distributionFitter
opens the Distribution Fitter app, or
brings focus to the app if it is already open.
distributionFitter(y)
opens the Distribution Fitter app
populated with the data specified by an array of scalar values,
y
.
distributionFitter(
uses the vector y
,cens
)cens
to specify whether the observation
y(j)
is censored, (cens(j)==1)
, or
observed exactly, (cens(j)==0)
. If cens
is
omitted or empty, then no y
values are censored.
If you have frequency data (freq
) but not censoring data
(cens
), then you must specify empty brackets
([]
) for cens
.
distributionFitter(
uses the vector y
,cens
,freq
)freq
to specify the frequency of each element
contained in y
. If freq
is omitted or
empty, then all values in y
have a frequency of 1.
If you have frequency data (freq
) but not censoring data
(cens
), then you must specify empty brackets
([]
) for cens
.
distributionFitter(
creates a data set with the name y
,cens
,freq
,dsname
)dsname
using the data vector,
y
, censoring indicator, cens
, and
frequency vector, freq
. Specify dsname
as
a character vector or string scalar, for example,
'mydata'
.
If you want to specify a data set name, but do not have censoring data
(cens
) or frequency data (freq
), then
you must specify empty brackets ([]
) for both
freq
and cens
.
Version History
Introduced before R2006aStarting in R2024a, the Distribution Fitter app uses the MATLAB default color scheme instead of static colors to determine the colors of graphics objects.
dfittool
is now called distributionFitter
.
The behavior remains the same, and there are no plans to remove support for
dfittool
.
MATLAB Command
You clicked a link that corresponds to this MATLAB command:
Run the command by entering it in the MATLAB Command Window. Web browsers do not support MATLAB commands.
Select a Web Site
Choose a web site to get translated content where available and see local events and offers. Based on your location, we recommend that you select: .
You can also select a web site from the following list
How to Get Best Site Performance
Select the China site (in Chinese or English) for best site performance. Other MathWorks country sites are not optimized for visits from your location.
Americas
- América Latina (Español)
- Canada (English)
- United States (English)
Europe
- Belgium (English)
- Denmark (English)
- Deutschland (Deutsch)
- España (Español)
- Finland (English)
- France (Français)
- Ireland (English)
- Italia (Italiano)
- Luxembourg (English)
- Netherlands (English)
- Norway (English)
- Österreich (Deutsch)
- Portugal (English)
- Sweden (English)
- Switzerland
- United Kingdom (English)