Main Content

Simulink.sdi.setSubplotLimits

Specify subplot limits for time plots in the Simulation Data Inspector

Since R2021a

    Description

    example

    Simulink.sdi.setSubplotLimits(r,c,Name,Value) configures the time and y-axis limits for the subplot at the location specified by r and c according to the values specified by one or more name-value pair arguments. You can specify any combination of a t-axis minimum, t-axis maximum, y-axis minimum, and y-axis maximum using name-value pair arguments.

    Note

    Limits for the t-axis apply to all linked time plots in the Simulation Data Inspector. For more information, see Linked Subplots.

    Examples

    collapse all

    You can use the Simulink.sdi.getSubplotLimits and Simulink.sdi.setSubplotLimits functions to copy the axis limits from one subplot to another. For example, you can specify the same y-axis limits for two subplots that display the same signal from simulations that used different values of a model parameter. This example copies the y-axis settings from one subplot to another to analyze the effect of changing the value of Mu in the model vdp.

    Create the data in the Simulation Data Inspector by simulating the model vdp twice. The first time, specify the value of Mu as 1. For the second simulation, set the value of Mu to 2. The model logs data for the signals x1 and x2.

    open_system("vdp");
    set_param("vdp/Mu","Gain","1")
    sim("vdp");
    
    set_param("vdp/Mu","Gain","2")
    sim("vdp");

    Open the Simulation Data Inspector.

    Simulink.sdi.view

    Create plots in the Simulation Data Inspector to show the results from each simulation. Configure a 2x2 subplot layout so you can plot one signal on each plot, side by side.

    Simulink.sdi.setSubPlotLayout(2,2)

    Get the Simulink.sdi.Signal objects that correspond to each signal from each run, and plot one signal on each subplot. Plot the signals from the first simulation on the subplots in the first column and the signals from the second simulation on the subplots in the second column.

    runIDs = Simulink.sdi.getAllRunIDs;
    runID1 = runIDs(end-1);
    runID2 = runIDs(end);
    
    runMu1 = Simulink.sdi.getRun(runID1);
    runMu2 = Simulink.sdi.getRun(runID2);
    
    sig1 = getSignalByIndex(runMu1,1);
    sig2 = getSignalByIndex(runMu1,2);
    sig3 = getSignalByIndex(runMu2,1);
    sig4 = getSignalByIndex(runMu2,2);
    
    plotOnSubPlot(sig1,1,1,true);
    plotOnSubPlot(sig2,2,1,true);
    plotOnSubPlot(sig3,1,2,true);
    plotOnSubPlot(sig4,2,2,true);

    The signals in the first column of plots look similar to those in the second column. However, the y-axis limits for the plots of the x2 signal are different.

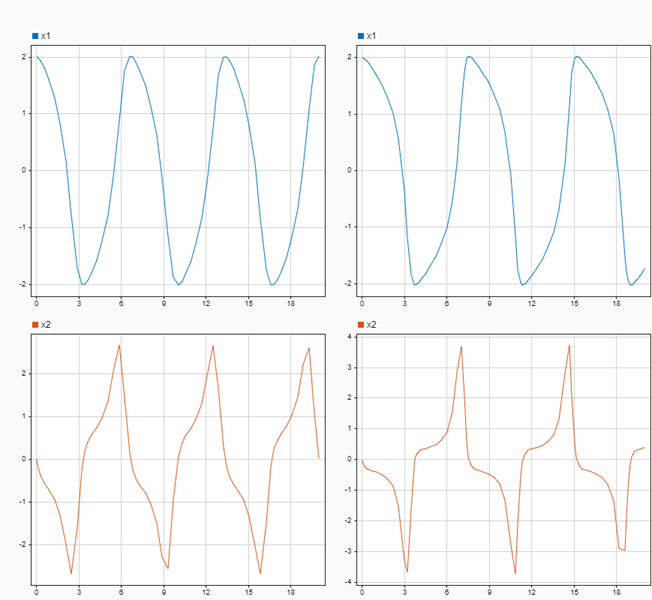
    Use the Simulink.sdi.getSubplotLimits function to copy the limits used for the subplot with the x2 signal from the second simulation.

    [~,~,ymin,ymax] = Simulink.sdi.getSubplotLimits(2,2);

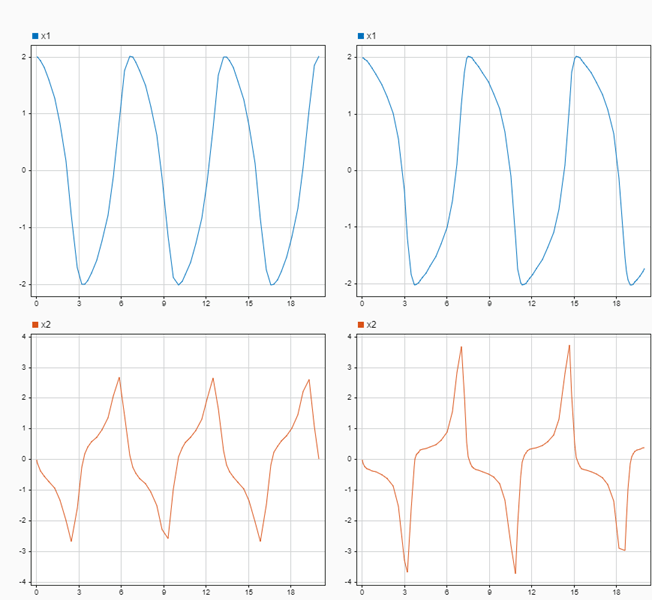
    Use the Simulink.sdi.setSubplotLimits function to apply the same y-axis limits to the subplot with the x2 signal from the first run.

    Simulink.sdi.setSubplotLimits(2,1,'yRange',[ymin,ymax]);

    With the updated y-axis limits, the difference in the x2 signal is more apparent.

    Input Arguments

    collapse all

    Subplot row index, specified as an integer between 1 and 8, inclusive. Use the r and c inputs together to specify the location of the subplot for which you want to specify axis limits.

    Example: Simulink.sdi.setSubplotLimits(2,2,'yrange',[0,3]) configures y-axis limits for the time plot in the second row of the second column of the subplot layout in the Simulation Data Inspector.

    Subplot column index, specified as an integer value between 1 and 8, inclusive. Use the r and c inputs together to specify the location of the subplot for which you want to specify axis limits.

    Example: Simulink.sdi.setSubplotLimits(2,2,'yrange',[0,3]) configures y-axis limits for the time plot in the second row of the second column of the subplot layout in the Simulation Data Inspector.

    Name-Value Arguments

    Specify optional pairs of arguments as Name1=Value1,...,NameN=ValueN, where Name is the argument name and Value is the corresponding value. Name-value arguments must appear after other arguments, but the order of the pairs does not matter.

    Before R2021a, use commas to separate each name and value, and enclose Name in quotes.

    Example: Simulink.sdi.setSubplotLimits(2,2,'ymin',0,'ymax',3) configures y-axis limits for the time plot in the second row of the second column of the subplot layout in the Simulation Data Inspector.

    Simulation Data Inspector view, specified as 'Inspect' or 'Compare'. Specify the view with the subplot for which you want to specify limits. When you omit the 'View' argument, the limits are applied to the specified subplot in the inspect view.

    Example: Simulink.sdi.setSubplotLimits(2,1,'View','Compare','yRange',[-2,2]) configures y-axis limits for the difference plot in the compare view of the Simulation Data Inspector.

    Data Types: char | string

    t-axis minimum, specified as a scalar.

    You can specify limits for the t-axis using the tMin and tMax name-value arguments, using the tRange argument, or using the AllRange argument. When you specify the tMin name-value pair argument, do not specify the tRange or AllRange arguments.

    Data Types: double

    t-axis maximum, specified as a scalar.

    You can specify limits for the t-axis using the tMin and tMax name-value arguments, the tRange argument, or the AllRange argument. When you specify the tMax name-value argument, do not specify the tRange or AllRange arguments.

    Data Types: double

    y-axis minimum, specified as a scalar.

    You can specify limits for the y-axis using the yMin and yMax name-value arguments, the yRange argument, or the AllRange argument. When you specify the yMin name-value argument, do not specify the yRange or AllRange arguments.

    Data Types: double

    y-axis maximum, specified as a scalar.

    You can specify limits for the y-axis using the yMin and yMax name-value arguments, the yRange argument, or the AllRange argument. When you specify the yMax name-value argument, do not specify the yRange or AllRange arguments.

    Data Types: double

    t-axis range, specified as a 1-by-2 vector that contains scalar numeric values.

    You can specify limits for the t-axis using the tMin and tMax name-value arguments, the tRange argument, or the AllRange argument. When you specify the tRange name-value argument, do not specify the tMin, tMax, or AllRange arguments.

    Example: Simulink.sdi.setSubplotLimits(1,1,'tRange',[-1,20]) configures the t-axis range for the subplot in the first row and first column of the Simulation Data Inspector subplot layout.

    Data Types: double

    y-axis range, specified as a 1-by-2 vector that contains scalar numeric values.

    You can specify limits for the y-axis using the yMin and yMax name-value arguments, the yRange argument, or the AllRange argument. When you specify the yRange name-value argument, do not specify the yMin, yMax, or AllRange arguments.

    Example: Simulink.sdi.setSubplotLimits(1,1,'yRange',[-5,5]) configures the y-axis range for the subplot in the first row and first column of the Simulation Data Inspector subplot layout.

    Data Types: double

    Ranges for t-axis and y-axis, specified as a 1-by-4 vector that contains scalar numeric values. The values specified in the vector are mapped to the t- and y-axis limits in this order: [tMin,tMax,yMin,yMax].

    When you specify the AllRange name-value argument, do not specify the tMin, tMax, yMin, yMax, tRange, or yRange arguments.

    Example: Simulink.sdi.setSubplotLimits(1,1,'AllRange',[-1,20,-5,5]) configures the t-axis range and y-axis range for the subplot in the first row and first column of the Simulation Data Inspector subplot layout.

    Data Types: double

    Version History

    Introduced in R2021a