Create Plots on Maps
Points, lines, and polygons; bubble charts; images; pseudocolor
plots
Visualize data on geographic axes and map axes. For illustrations of the types of plots you can create with geographic axes and map axes, see Types of 2-D Geographic Plots. For information about the differences between geographic axes and map axes, see Choose a 2-D Map Display.
Functions
Properties
Topics
Plots
- Create 2-D Plots Using Map Axes
Display data on a map using point, line, and polygon plots, bubble charts, images, and pseudocolor raster plots. - Create Maps Using Icons
Use icons on maps to represent and display data, animate movement along paths, and annotate basemaps. (Since R2024b) - Control Color and Transparency of Icon Chart
Change the color or hide the background of an icon by using the color and transparency properties of the icon chart object. (Since R2024b) - Create Binned Scatter Plot from Latitude and Longitude Data
Display a binned scatter plot on a map using data in latitude and longitude coordinates. (Since R2026a)
Animations and Apps
- Create Animations Using Latitude and Longitude Data
Animate geographic data using comet plots, animated lines, and markers along lines. - Create Animations Using Raster Data
Visualize changes over time by animating raster data on a map. (Since R2026a) - Create Map Axes in App
Use App Designer to create an app that includes a map axes object and components that control the map projection and the visibility of plotted data.
Related Information
Featured Examples
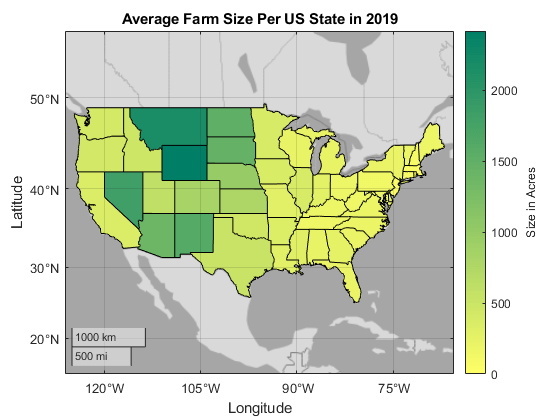
Create Choropleth Map from Table Data
Create a map that illustrates numeric attributes using colors along a gradient.
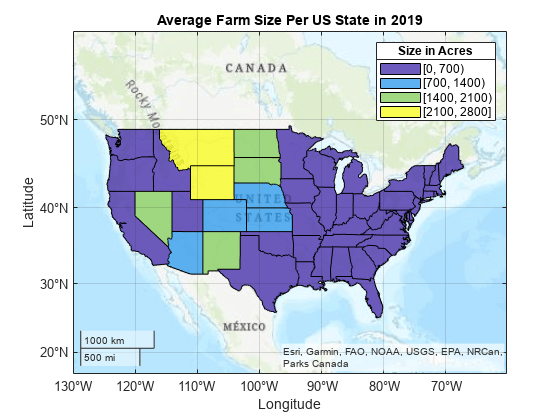
Create Classification Map from Table Data
Create a map that illustrates categorical attributes using discrete colors.