geoplayer
Visualize streaming geographic map data
Description
A geoplayer object is a geographic player that displays the
streaming coordinates of a driving route on a map.
To display the driving route of a vehicle, use the
plotRoutefunction.To display the position of a vehicle as it drives along a route, use the
plotPositionfunction. You can plot the position of multiple vehicles on different routes simultaneously by specifying a unique track ID for each route. For more information, see the'TrackID'name-value pair argument onplotPosition.To change the underlying map, or basemap, of the
geoplayerobject, update theBasemapproperty of the object. For more information, see Custom Basemaps.
Creation
Syntax
Description
player = geoplayer(___,
sets properties using one or more name-value pairs, in addition to
specifying input arguments from previous syntaxes. For example,
Name,Value)geoplayer(45,0,'HistoryDepth',5) creates a geographic
player centered at the latitude-longitude coordinate (45, 0), and sets the
HistoryDepth property such that the player displays the five
previous geographic coordinates.
Input Arguments
Properties
Number of previous geographic coordinates to display, specified as a
nonnegative integer or Inf. A value of
0 displays only the current geographic coordinates. A
value of Inf displays all geographic coordinates
previously plotted using the plotPosition function.
You can set this property only when you create the object. After you create the object, this property is read-only.
Style of displayed geographic coordinates, specified as one of these values:
'point'— Display the coordinates as discrete, unconnected points.'line'— Display the coordinates as a single connected line.
You can set this property when you create the object. After you create the object, this property is read-only.
Map on which to plot data, specified as one of the basemap names in this
table, 'none', or a custom basemap defined using the
addCustomBasemap function. For more information on adding
custom basemaps, see Custom Basemaps. For
examples on how to add custom basemaps, see Display Data on OpenStreetMap Basemap and
Display Data on HERE Basemap.
|
|
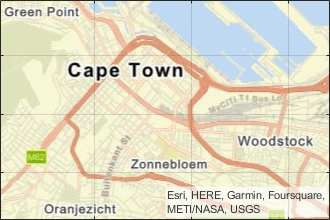
Street map data composed of geographic map tiles using the World Street Map provided by Esri®. For more information about the map, see World Street Map on the Esri ArcGIS website. Hosted by Esri. |
|
Map designed to provide geographic context while highlighting user data on a light background. Hosted by Esri. |
|
|
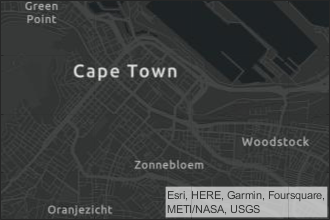
Map designed to provide geographic context while highlighting user data on a dark background. Hosted by Esri. |
|
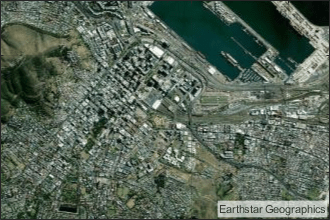
Full global basemap composed of high-resolution satellite imagery. Hosted by Esri. |
|
|
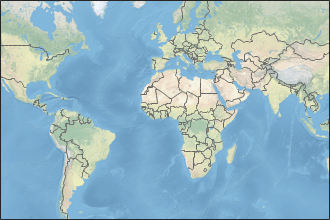
General-purpose map with styling to depict topographic features. Hosted by Esri. |
|
Map that combines satellite-derived land cover data, shaded relief, and ocean-bottom relief. The light, natural palette is suitable for thematic and reference maps. Created using Natural Earth. |
|
|
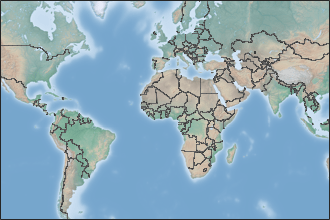
Shaded relief map blended with a land cover palette. Humid lowlands are green and arid lowlands are brown. Created using Natural Earth. |
|
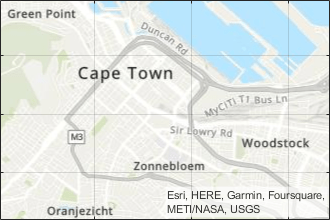
Terrain map in shades of gray. Shaded relief emphasizes both high mountains and micro-terrain found in lowlands. Created using Natural Earth. |
|
|
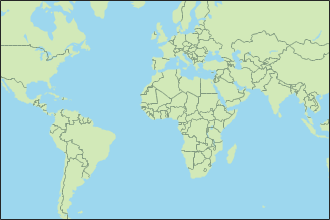
Two-tone, land-ocean map with light green land areas and light blue water areas. Created using Natural Earth. |
|
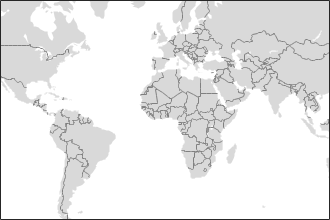
Two-tone, land-ocean map with gray land areas and white water areas. Created using Natural Earth. |
|
|
Two-tone, land-ocean map with light gray land areas and dark gray water areas. This basemap is installed with MATLAB®. Created using Natural Earth. | N/A |
Geographic axes plots your data with latitude-longitude grid, ticks, and labels but does not include a map. |


By default, access to basemaps requires an Internet connection. The
exception is the 'darkwater' basemap, which is installed
with MATLAB.
If you do not have consistent access to the Internet, you can download the basemaps created using Natural Earth onto your local system by using the Add-On Explorer. The basemaps hosted by Esri are not available for download. For more information about downloading basemaps, see Access Basemaps for Geographic Axes and Charts.
The basemaps hosted by Esri update periodically. As a result, you might see differences in your visualizations over time.
Alignment of boundaries and region labels are a presentation of the feature provided by the data vendors and do not imply endorsement by MathWorks®.
Example: player =
geoplayer(latCenter,lonCenter,'Basemap','darkwater')
Example: player.Basemap = 'darkwater'
Data Types: char | string
Recenter display based on the specified track ID, specified as a positive
integer. The geoplayer object recenters the map when the
new position, specified by latCenter and
lonCenter, moves outside of the current viewable
map area. You can also use this property to recenter the map on a previously
drawn track that is outside of the viewable area. Define the track ID by
using the 'TrackID' name-value pair argument when you
call the plotPosition object function.
Parent axes of the geographic player, specified as a
Figure graphics object or Panel
graphics object. If you do not specify Parent, then
geoplayer creates the geographic player in a new
figure.
You can set this property when you create the object. After you create the object, this property is read-only.
This property is read-only.
Axes used by geographic player, specified as a
GeographicAxes object. Use this axes to customize the
map that the geographic player displays. For an example, see Customize Geographic Axes. For
details on the properties that you can customize, see GeographicAxes Properties.
Object Functions
Examples
Load a sequence of latitude and longitude coordinates.
data = load('geoSequence.mat');Create a geographic player and configure it to display all points in its history.
zoomLevel = 17;
player = geoplayer(data.latitude(1),data.longitude(1),zoomLevel,'HistoryDepth',Inf);
Display the sequence of coordinates.
  for i = 1:length(data.latitude)
      plotPosition(player,data.latitude(i),data.longitude(i));
      pause(0.01)
  end

Load a sequence of latitude and longitude coordinates.
data = load('geoRoute.mat');Create a geographic player and set the zoom level to 12. Compared to the default zoom level, this zoom level zooms the map out by a factor of 8.
player = geoplayer(data.latitude(1),data.longitude(1),12);
Display the full route.
plotRoute(player,data.latitude,data.longitude);
Display the coordinates in a sequence. The circle marker indicates the current position.
for i = 1:length(data.latitude)
    plotPosition(player,data.latitude(i),data.longitude(i));
    pause(0.05)
end

This example shows how to display a driving route and vehicle positions on an OpenStreetMap® basemap.
Add the OpenStreetMap basemap to the list of basemaps available for use with the geoplayer object. After you add the basemap, you do not need to add it again in future sessions.
name = 'openstreetmap';
url = 'https://a.tile.openstreetmap.org/${z}/${x}/${y}.png';
copyright = char(uint8(169));
attribution = copyright + "OpenStreetMap contributors";
addCustomBasemap(name,url,'Attribution',attribution)
Load a sequence of latitude and longitude coordinates.
data = load('geoRoute.mat');Create a geographic player. Center the geographic player on the first position of the driving route and set the zoom level to 12.
zoomLevel = 12;
player = geoplayer(data.latitude(1),data.longitude(1),zoomLevel);

Display the full route.
plotRoute(player,data.latitude,data.longitude);

By default, the geographic player uses the World Street Map basemap ('streets') provided by Esri®. Update the geographic player to use the added OpenStreetMap basemap instead.
player.Basemap = 'openstreetmap';
Display the route again.
plotRoute(player,data.latitude,data.longitude);

Display the positions of the vehicle in a sequence.
for i = 1:length(data.latitude)
   plotPosition(player,data.latitude(i),data.longitude(i))
end

Display a driving route on a basemap provided by HERE Technologies. To use this example, you must have a valid license from HERE Technologies.
Specify the basemap name and map URL.
name = 'herestreets';
url = ['https://1.base.maps.ls.hereapi.com/maptile/2.1/maptile/', ...
    'newest/normal.day/${z}/${x}/${y}/256/png?apikey=%s'];
Maps from HERE Technologies require a valid license. Create a dialog box. In the dialog box, enter the Access Key ID corresponding to your HERE license.
prompt = {'HERE Access Key ID:'};
title = 'HERE Tokens';
dims = [1 40]; % Text edit field height and width
hereTokens = inputdlg(prompt,title,dims);
If the license is valid, specify the HERE credentials and a custom attribution, load coordinate data, and display the coordinates on the HERE basemap using a geoplayer object. If the license is not valid, display an error message.
if ~isempty(hereTokens)

    % Add HERE basemap with custom attribution.
    url = sprintf(url,hereTokens{1});
    copyrightSymbol = char(169); % Alt code
    attribution = [copyrightSymbol,' ',datestr(now,'yyyy'),' HERE'];
    addCustomBasemap(name,url,'Attribution',attribution);

    % Load sample lat,lon coordinates.
    data = load('geoSequence.mat');

    % Create geoplayer with HERE basemap.
    player = geoplayer(data.latitude(1),data.longitude(1), ...
        'Basemap','herestreets','HistoryDepth',Inf);

    % Display the coordinates in a sequence.
    for i = 1:length(data.latitude)
        plotPosition(player,data.latitude(i),data.longitude(i));
    end

else
    error('You must enter valid credentials to access maps from HERE Technologies');
end

Customize the geographic axes of a geoplayer object by adding a custom line between route endpoints.
Load a driving route and vehicle positions along that route.
data = load("geoRoute.mat");Create a geographic player that is centered on the first position of the vehicle.
zoomLevel = 10;
player = geoplayer(data.latitude(1),data.longitude(1),zoomLevel);

Display the full route.
plotRoute(player,data.latitude,data.longitude);

Display positions of the vehicle along the route.
for i = 1:length(data.latitude)
    plotPosition(player,data.latitude(i),data.longitude(i))
end

Customize the geographic axes by adding a line between the two endpoints of the route.
geoplot(player.Axes,[data.latitude(1) data.latitude(end)], ...
    [data.longitude(1) data.longitude(end)],'g-*')

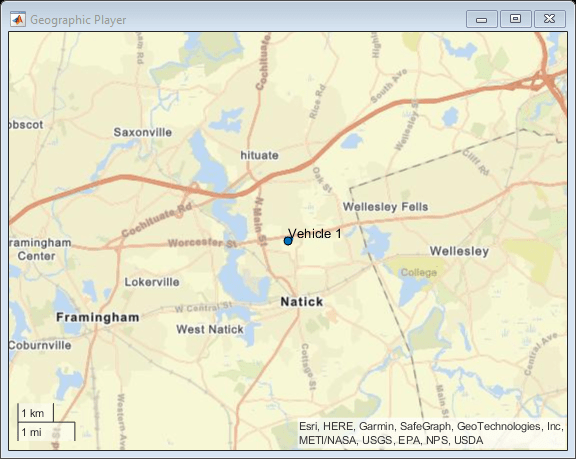
Plot multiple routes simultaneously in a geographic player. First, assign each route a unique identifier. Then, when plotting points on the routes using the plotPosition object function, specify the route identifier using the 'TrackID' name-value pair argument. In this example, the routes are labeled Vehicle 1 and Vehicle 2. This screen capture shows the point where the two routes are about to cross paths.

Load data for a route.
data = load('geoRoute.mat');Extract data for the first vehicle.
lat1 = data.latitude;
lon1 = data.longitude;
Create a synthetic route for the second vehicle that drives the same route in the opposite direction.
lat2 = flipud(lat1);
lon2 = flipud(lon1);
Create a geoplayer object. Initialize the player to display the last 10 positions as a line trailing the current position.
zoomLevel = 12;
player = geoplayer(lat1(1),lon1(1),zoomLevel,...
    'HistoryDepth',10,'HistoryStyle','line');
Plot the positions of both vehicles as they move over the route. Specify an ID for each track by using the 'TrackID' name-value pair argument. By default, the geoplayer object centers the display of the vehicle on the first track. You can center the display on other tracks by using the CenterOnID property of the geoplayer object.
loopCounter = length(lat1);
for i = 1:loopCounter
     plotPosition(player,lat1(i),lon1(i),'TrackID',1,'Label','Vehicle 1');
     plotPosition(player,lat2(i),lon2(i),'TrackID',2,'Label','Vehicle 2');
end
Limitations
Geographic map tiles are not available for all locations.
More About
Tips
When the
geoplayerobject plots a position that is outside the current view of the map, the object automatically scrolls the map.
Version History
Introduced in R2018a
See Also
Functions
geobubble|geoaxes|geobasemap|geoplot|geolimits|latlon2local|local2latlon|addCustomBasemap|removeCustomBasemap