plot
Plot planned vehicle path
Description
plot(
specifies options using one or more name-value pair arguments. For example,
refPath,Name,Value)plot(path,'Vehicle','off') plots the path without
displaying the vehicle.
Examples
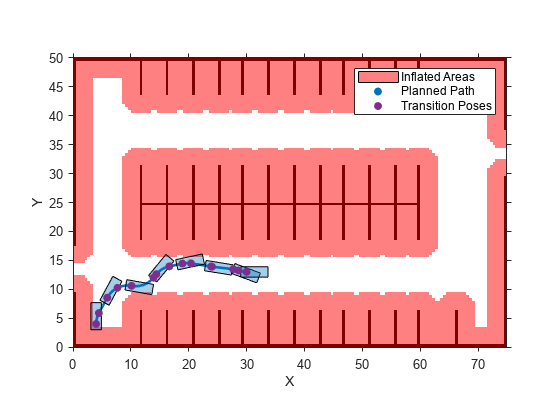
Plan a vehicle path through a parking lot by using the optimal rapidly exploring random tree (RRT*) algorithm. Check that the path is valid, and then plot the transition poses along the path.
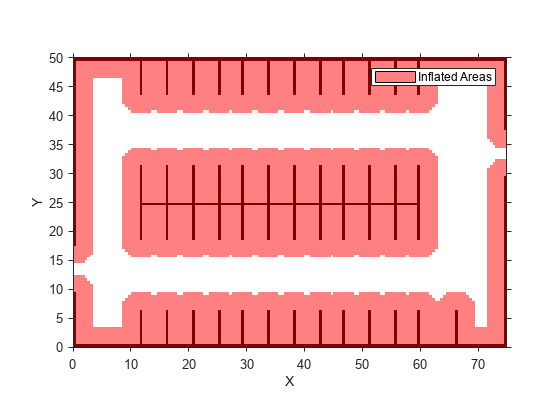
Load a costmap of a parking lot. Plot the costmap to see the parking lot and inflated areas for the vehicle to avoid.
data = load('parkingLotCostmap.mat');
costmap = data.parkingLotCostmap;
plot(costmap)
Define start and goal poses for the vehicle as [x, y, Θ] vectors. World units for the (x,y) locations are in meters. World units for the Θ orientation angles are in degrees.
startPose = [4, 4, 90]; % [meters, meters, degrees]
goalPose = [30, 13, 0];
Use a pathPlannerRRT object to plan a path from the start pose to the goal pose.
planner = pathPlannerRRT(costmap);
refPath = plan(planner,startPose,goalPose);
Check that the path is valid.
isPathValid = checkPathValidity(refPath,costmap)
isPathValid = logical
   1
Interpolate the transition poses along the path.
transitionPoses = interpolate(refPath);
Plot the planned path and the transition poses on the costmap.
hold on
plot(refPath,'DisplayName','Planned Path')
scatter(transitionPoses(:,1),transitionPoses(:,2),[],'filled', ...
    'DisplayName','Transition Poses')
hold off

Input Arguments
Planned vehicle path, specified as a driving.Path object.
Name-Value Arguments
Specify optional pairs of arguments as
Name1=Value1,...,NameN=ValueN, where Name is
the argument name and Value is the corresponding value.
Name-value arguments must appear after other arguments, but the order of the
pairs does not matter.
Before R2021a, use commas to separate each name and value, and enclose
Name in quotes.
Example: 'Inflation','off'
Axes object in which to draw the plot, specified as the
comma-separated pair consisting of 'Parent' and an
axes object. If you do
not specify Parent, a new figure is created.
Display vehicle, specified as the comma-separated pair consisting of
'Vehicle' and 'on' or
'off'. Setting this argument to
'on' displays the vehicle along the path.
Dimensions of the vehicle, specified as the comma-separated pair
consisting of 'VehicleDimensions' and a vehicleDimensions object.
Name of the entry in the legend, specified as the comma-separated pair
consisting of 'DisplayName' and a character vector or
string scalar.
Path color, specified as the comma-separated pair consisting of
'Color' and a color name, short color name, or
RGB triplet.
For a
custom color, specify an RGB triplet. An RGB triplet is a three-element row vector whose
elements specify the intensities of the red, green, and blue components of the color. The
intensities must be in the range [0,1]; for example, [0.4 0.6
0.7]. Alternatively, you can specify some common colors by name. This table lists
the named color options and the equivalent RGB triplet values.
| Color Name | Color Short Name | RGB Triplet | Appearance |
|---|---|---|---|
'red' | 'r' | [1 0 0] |
|
'green' | 'g' | [0 1 0] |
|
'blue' | 'b' | [0 0 1] |
|
'cyan'
| 'c'
| [0 1 1] |
|
'magenta' | 'm' | [1 0 1] |
|
'yellow' | 'y' | [1 1 0] |
|
'black' | 'k' | [0 0 0] |
|
'white' | 'w' | [1 1 1] |
|
Example: 'Color',[1 0 1]
Example: 'Color','m'
Example: 'Color','magenta'
Tag to identify path, specified as the comma-separated pair consisting
of 'Tag' and a character vector or string scalar.
Version History
Introduced in R2018a
See Also
Functions
Objects
Topics
MATLAB Command
You clicked a link that corresponds to this MATLAB command:
Run the command by entering it in the MATLAB Command Window. Web browsers do not support MATLAB commands.
Web サイトの選択
Web サイトを選択すると、翻訳されたコンテンツにアクセスし、地域のイベントやサービスを確認できます。現在の位置情報に基づき、次のサイトの選択を推奨します:
また、以下のリストから Web サイトを選択することもできます。
最適なサイトパフォーマンスの取得方法
中国のサイト (中国語または英語) を選択することで、最適なサイトパフォーマンスが得られます。その他の国の MathWorks のサイトは、お客様の地域からのアクセスが最適化されていません。
南北アメリカ
- América Latina (Español)
- Canada (English)
- United States (English)
ヨーロッパ
- Belgium (English)
- Denmark (English)
- Deutschland (Deutsch)
- España (Español)
- Finland (English)
- France (Français)
- Ireland (English)
- Italia (Italiano)
- Luxembourg (English)
- Netherlands (English)
- Norway (English)
- Österreich (Deutsch)
- Portugal (English)
- Sweden (English)
- Switzerland
- United Kingdom (English)