boundary
区分的分布境界
説明
例
標本データ セットを生成し、パレート分布の裾をもつ区分的分布を生成されたデータに当てはめることにより、paretotails オブジェクトを作成します。オブジェクト関数 boundary を使用して、paretotails オブジェクトのセグメント間の境界点を求めます。
20% の外れ値が含まれている標本データ セットを生成します。
rng('default');  % For reproducibility
left_tail = -exprnd(1,100,1);
right_tail = exprnd(5,100,1);
center = randn(800,1);
x = [left_tail;center;right_tail];
区分的分布を x に当てはめることにより paretotails オブジェクトを作成します。当てはめたオブジェクトがデータ セットの中間 80% については経験分布、データ セットの下位および上位 10% については一般化パレート分布 (GPD) から構成されるように、下裾と上裾の累積確率を使用して裾の境界を指定します。
pd = paretotails(x,0.1,0.9)
pd =
Piecewise distribution with 3 segments
      -Inf < x < -1.33251    (0 < p < 0.1): lower tail, GPD(-0.0063504,0.567017)
   -1.33251 < x < 1.80149  (0.1 < p < 0.9): interpolated empirical cdf
        1.80149 < x < Inf    (0.9 < p < 1): upper tail, GPD(0.24874,3.00974)
関数 boundary を使用して、区分的セグメント間の境界値を取得します。
[p,q] = boundary(pd)
p = 2×1

    0.1000
    0.9000
q = 2×1

   -1.3325
    1.8015
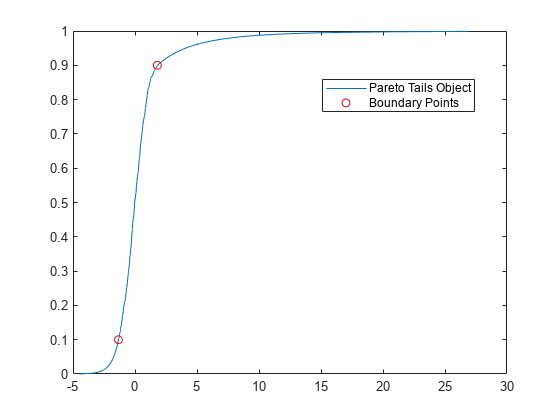
p 内の値は境界における累積確率、q 内の値は対応する分位数です。
paretotails オブジェクトの cdf をプロットし、Figure で境界点をマークします。
xi = sort(x);
plot(xi,cdf(pd,xi))
hold on
plot(q,p,'ro')
legend('Pareto Tails Object','Boundary Points','Location','best')
hold off
入力引数
出力引数
バージョン履歴
R2007a で導入