Breakpoints List
Description
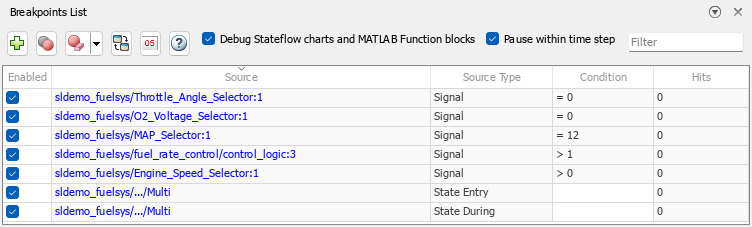
The Breakpoints List provides information about all breakpoints configured in your model, including breakpoints in Stateflow® charts and code for MATLAB Function blocks. The Breakpoints List displays breakpoints configured throughout the model hierarchy.
Using the Breakpoints List, you can:
View all breakpoints in the model along with breakpoint information, such as the breakpoint source.
Navigate to the location of each breakpoint in the model hierarchy.
Enable and disable individual breakpoints or all breakpoints.
Delete breakpoints.
Enable and disable low-level debugging that provides options to:
Step through simulation block by block.
Pause within a time step as soon as a breakpoint condition is met.
Add model breakpoints to pause when a condition, such as an
InforNaNvalue, occurs anywhere in the model.
Highlight and trace signal paths to their sources by using Model Slicer when your simulation pauses on a breakpoint. A Simulink® Check™ license is required to open Model Slicer from the Breakpoints List. For more information, see Trace Faulty Signal Paths Using Model Slicer at Signal Breakpoints (Simulink Check).
Breakpoints are not saved as part of the model.
Open the Breakpoints List
Simulink Toolstrip: On the Debug tab, click Breakpoints List.
Simulink Editor: Click the breakpoint icon on a signal that has a breakpoint.
When you open the Breakpoints List by clicking a breakpoint, the row for the breakpoint you clicked is highlighted purple in the table.
Examples
A signal breakpoint causes the simulation to pause when the signal value satisfies the specified condition.
Add a signal breakpoint using the Simulink Toolstrip.
Select a signal in your model.
On the Debug tab, click Add Breakpoint.
In the Add Breakpoint dialog box, specify the condition for the breakpoint. From the drop-down list, select the relational operator for the condition. Then, in the text box, specify the value.
For example, to pause the simulation when the signal value is equal to
0, select the equals (==) relational operator and enter0in the text box.Click OK.
The red circle on the signal line indicates that a breakpoint is configured for that signal.

Add another breakpoint using the context menu for the signal.
Select a signal in the model.
Right-click the selected signal, and then select Add Breakpoint
 .
.In the Add Breakpoint dialog box, specify the condition for the breakpoint.
For example, to pause the simulation when the signal value is greater than
5, select the greater than (>) relational operator and enter5in the text box.Click OK.
After adding breakpoints to your model, you can use the Breakpoints List to view and manage the breakpoints throughout your model.
To open the Breakpoints List, on the Debug tab, click Breakpoints List. The Breakpoints List opens docked at the bottom of the Simulink Editor. The table lists all the breakpoints configured in the model hierarchy, including breakpoints in Stateflow charts, along with information about each breakpoint.
Using the Breakpoints List, you can enable and disable individual
breakpoints or all breakpoints. The simulation pauses when the condition for an enabled
breakpoint is met and ignores disabled breakpoints. You can enable and disable
breakpoints during and between debugging sessions. To enable or disable an individual
breakpoint, use the check box in the Enabled column of the table.
To enable or disable all breakpoints in the model hierarchy, click Enable or disable all
breakpoints ![]() .
.
The table summarizes how a breakpoint appears in the block diagram based on its status.
| Breakpoint Appearance | Breakpoint Status |
|---|---|
Enabled | |
Hit | |
Disabled | |
Invalid |
You can also delete breakpoints.
To delete an individual breakpoint, pause on the row for the breakpoint, then click Delete breakpoint
 .
.To delete multiple breakpoints, select the breakpoints to delete in the table. Then, click Delete selected breakpoints
 .
.To delete all breakpoints, click the Delete selected breakpoints button arrow and select Delete all breakpoints.
Breakpoints are not saved as part of the model.
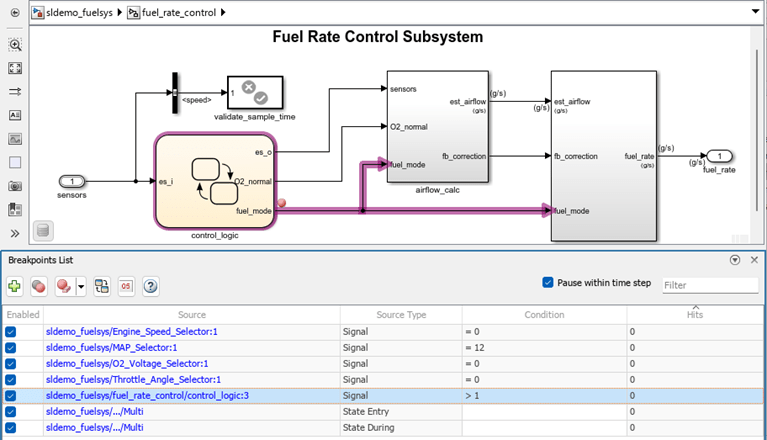
Using the Breakpoints List, you can navigate easily to each breakpoint in the model and determine which row of the Breakpoints List contains information about a given breakpoint.
To navigate to a specific breakpoint from the Breakpoints List, click the hyperlink for the breakpoint in the table. A new tab opens in the Simulink Editor to show the component that contains the breakpoint. The source for the breakpoint is highlighted purple.
To get more information about a breakpoint you find as you navigate through your
model, click the breakpoint ![]() . The row for that breakpoint in the Breakpoints
List is highlighted purple.
. The row for that breakpoint in the Breakpoints
List is highlighted purple.
When a simulation is paused, you can use Model Slicer to highlight
and trace the signal paths from breakpoints back to their sources. The Debug using Slicer
button changes from ![]() to
to ![]() in the Breakpoints List when the simulation
is paused. Clicking Debug using Model Slicer
in the Breakpoints List when the simulation
is paused. Clicking Debug using Model Slicer ![]() sets a starting point to the signal associated with the
current breakpoint. You can add multiple breakpoints, change between the breakpoints, add
additional starting points, and switch the highlight direction to see the upstream or
downstream impact of the values.
sets a starting point to the signal associated with the
current breakpoint. You can add multiple breakpoints, change between the breakpoints, add
additional starting points, and switch the highlight direction to see the upstream or
downstream impact of the values.
Pause the simulation and add a signal breakpoint.
Open the Breakpoints List. In the Simulink Toolstrip, on the Debug tab, click Breakpoints List.
To add a starting point from the breakpoint, click Debug using Slicer
![]() .
.
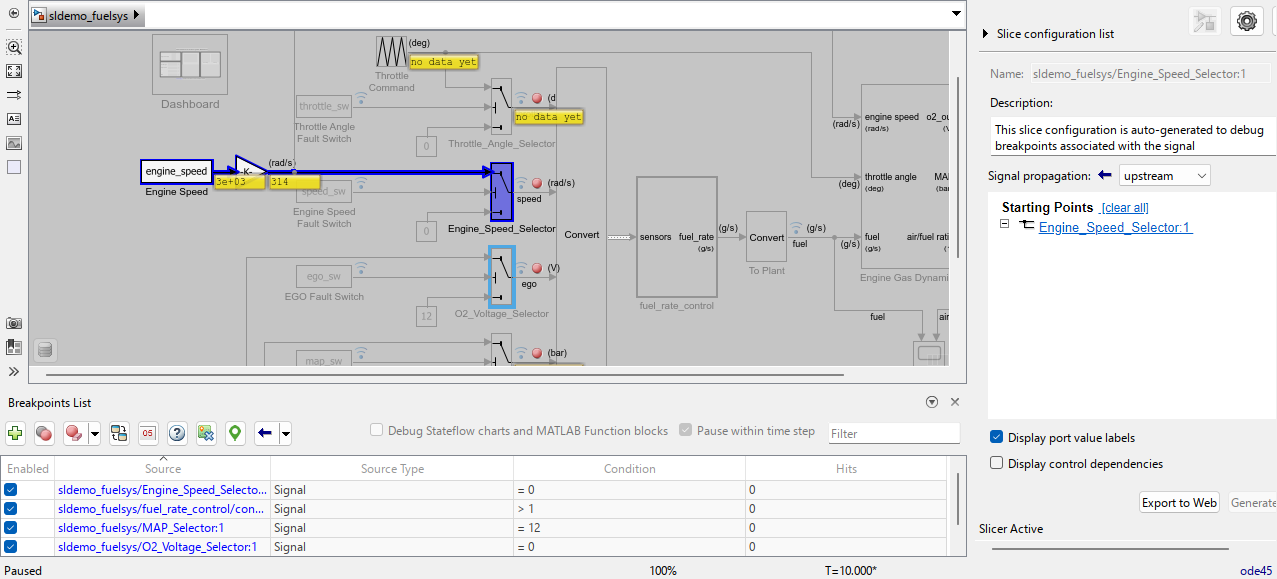
To add another starting point, select a block or signal and click Add as Starting
Point ![]() in the Breakpoints List.
in the Breakpoints List.
To view the upstream, downstream, and bidirectional flow of the signals in the
model, click the upstream button ![]() , the downstream button
, the downstream button ![]() , or the bidirectional button
, or the bidirectional button
![]() .
.
To close the Model Slicer, click Close Model Slicer ![]() in the Breakpoints List.
in the Breakpoints List.
Tracing paths are not preserved when you exit the debugging session.
Related Examples
Parameters
Debugging Behavior
By default, models have Pause within time step selected to enable low-level debugging. This table summarizes debugging feature behavior and availability with and without low-level debugging enabled.
| Debugging Feature | Low-Level Debugging Enabled | Low-Level Debugging Disabled |
|---|---|---|
Block by block stepping | You can start stepping block by block to start a simulation and when a simulation is paused. | Not supported. |
Signal breakpoints | The simulation pauses within a time step, as soon as the condition for the breakpoint is met. | The simulation pauses at the end of the time step in which the condition for a breakpoint is met. |
Model breakpoints | You can add breakpoints to pause the simulation if these conditions occur anywhere in the model:
| Not supported. |
Note
Low-level debugging is supported only for normal mode simulations. This parameter has no effect on accelerator and rapid accelerator simulations.
Since R2025a
Select this option to enable the Allow setting breakpoints during simulation parameter. By default, the parameter is disabled.
When you select this option to enable the parameter, you can add breakpoints during simulation to Stateflow charts, State Transition blocks, Truth Table blocks, and code for MATLAB Function blocks.
When Pause within time step is selected, selecting this option also enables stepping into and out of Stateflow charts, State Transition blocks, Truth Table blocks, and MATLAB Function blocks while stepping through the simulation block by block.
Using the check box next to each breakpoint in the Breakpoints List, you can enable and disable individual breakpoints during and between debugging sessions. When the check box is selected, the breakpoint is active, and the simulation pauses when the condition for the breakpoint is met. When the check box is cleared, the breakpoint is inactive, and the simulation does not pause because of that breakpoint.
To enable or disable all breakpoints configured in the model, click Enable or
disable all breakpoints ![]() .
.
Signal Breakpoints
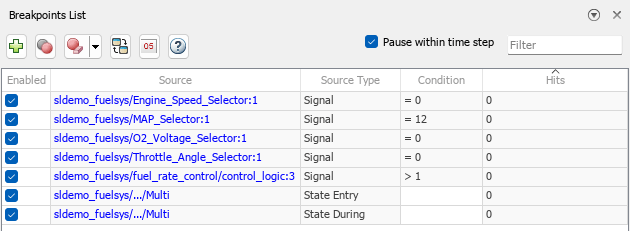
The Breakpoints List contains a row for each signal breakpoint you
configure in the model. Each signal breakpoint has a condition, and the simulation
pauses when the signal value satisfies that condition. The condition consists of a
relational operator, such as equals (==) or greater than
(>), and a value. For example, for a signal breakpoint condition of
> 1, the simulation pauses when the signal value is greater than
one.
Model Breakpoints
By default, no model breakpoints are configured for a model. To add the zero-crossing breakpoint to a model, on the Debug tab, click the button arrow next to Add Breakpoint and select Zero Crossing. After you add the zero-crossing breakpoint, you can enable and disable the zero-crossing breakpoint from the Breakpoints List during and between debugging sessions for the model.
When the simulation pauses due to an active zero-crossing breakpoint, the Simulink Editor opens a tab to display the subsystem or model that contains the block where the zero crossing occurred and highlights the block in green.
By default, no model breakpoints are configured for a model. To add the
NaN or Inf value breakpoint to a model, on the
Debug tab, click the button arrow next to Add
Breakpoint and select NaN or Inf Value. After you add
the NaN or Inf value breakpoint, you can enable
and disable the NaN or Inf value breakpoint from
the Breakpoints List during and between debugging sessions for the
model.
When the NaN or Inf value breakpoint is
enabled for a model, the simulation pauses when a computation results in a
NaN or Inf value. NaN or
Inf values can occur when the computation result is infinite or
outside of the range of values supported by the machine running the simulation.
When the simulation pauses due to an active NaN or
Inf breakpoint, the Simulink Editor opens a tab to
display the subsystem or model that contains the block where the NaN
or Inf value occurred and highlights the block in green.
Use the NaN or Inf value breakpoint to help
locate the site of computational errors in a model.
Limitations
These limitations apply to signal breakpoints when Pause within time step is either selected or cleared:
Signal breakpoints do not support specifying the breakpoint condition using variables, MATLAB® expressions, or symbols such as π.
Signal breakpoints are supported only for real scalar signals with these data types:
doublesingleintBooleanFixed-point
For fixed-point signals, the software converts the data type of the signal value to
doubleand uses the converted value to check for the breakpoint condition.
Signal breakpoints are supported for only Simulink signals and are not supported for other types of signals, such as Simscape™ signals.
Breakpoints on buses are not supported.
Setting a breakpoint on an input port created using an In Bus Element block is supported only when the port loads a leaf signal with scalar values.
Breakpoints in model references are not supported in accelerator mode simulations.
In normal mode, breakpoints in model references are supported only for the instance that has normal mode visibility. For more information, see Simulate Multiple Referenced Model Instances in Normal Mode.
Breakpoints on the outputs of root-level input ports of referenced models inside variant subsystems are supported only for the active variant choice.
The limitations for port value labels also apply for signal breakpoints. For details, see Additional Considerations for Using Port Value Labels.
These limitations apply to signal breakpoints only when Pause within time step is selected:
Stepping into a model reference is supported only for the instance that has normal mode visibility. For more information, see Simulate Multiple Referenced Model Instances in Normal Mode.
You can set breakpoints on input ports of subsystems, but the breakpoints do not pause the simulation and appear as invalid in the block diagram.
Accelerator mode does not support stepping block by block or pausing within a time step.
Signal breakpoints always pause accelerator mode simulations between time steps. (since R2026a)
Before R2026a: Signal breakpoints are supported only in normal mode simulations.
Before R2025a: You can set breakpoints on the outputs of root-level input ports, but the breakpoints do not pause the simulation and appear as invalid in the block diagram. To pause the simulation based on the signal value, add a breakpoint on the output of the block that produces the signal the port receives.
Model breakpoints are supported only in normal mode simulations and only when Pause within time step is selected.
Using Model Slicer to trace signals from breakpoints is supported when:
The model simulates in normal mode.
The simulation is paused on a signal breakpoint.
The stepping and breakpoint options in the Simulink Editor do not have a direct programmatic equivalent. The Simulink debugging programmatic interface includes options for setting breakpoints and stepping through simulations. However, the behavior of these functions is not identical to the behavior of the stepping options in the Simulink Editor. For more information about programmatic debugging, see Simulink Debugging Programmatic Interface.
Tips
To view signal values in the model while debugging, use port value labels. To add a port value label for a signal, select the signal. Then, on the Debug tab, in the Tools section, next to Output Values, click Show Output Value of selected signal
 . For more information, see View Signal Values Using Port Value Labels.
To save time when iteratively debugging, consider enabling fast restart. With fast restart enabled, the model compiles only the first time you simulate. Subsequent simulations run faster by skipping the compilation phase. While fast restart is enabled, you can modify the model only in ways that do not require compiling the model. For more information, see How Fast Restart Improves Iterative Simulations.
To enable stepping into Stateflow charts during a simulation debugging session, enable the Allow setting breakpoints during simulation configuration parameter before starting the simulation debugging session.
While paused within a time step, the MATLAB command prompt is replaced with the
sldebugcommand prompt. You can use some of the programmatic debugging functions, including thedispfunction, to get more information about the system behavior. For more information, see Simulink Debugging Programmatic Interface.By default, the Breakpoints List opens as a pane at the bottom of the Simulink Editor. You can reposition the Breakpoints List to suit your workflow.
To dock the Breakpoints List to a different part of the Simulink Editor, drag the pane to another part of the window.
To minimize the Breakpoints List, click the arrow
 in the upper right and select
Minimize.
in the upper right and select
Minimize.To use the Breakpoints List as a separate window, drag the pane out of the Simulink Editor or click the arrow
in the upper right and select
Undock.
Version History
Introduced in R2022aYou can enable the Allow setting breakpoints during simulation model configuration parameter from the Breakpoints List by selecting Debug Stateflow charts and MATLAB Function blocks. With the Allow setting breakpoints during simulation parameter enabled, you can:
Add breakpoints in Stateflow charts, State Transition Table blocks, Truth Table blocks, and MATLAB Function blocks during simulation.
Step into and out of Stateflow charts, State Transition Table blocks, and MATLAB Function blocks while stepping block by block through simulation.
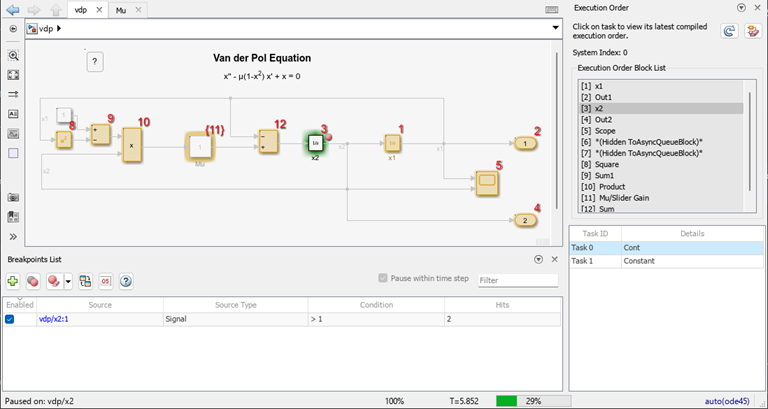
The Execution Order viewer has improved support for debugging simulations by stepping through simulation block by block.
Execution order highlighting no longer conflicts with the block-by-block debugging highlighting that indicates the block on which the simulation is paused.
The Execution Order viewer highlights the row in the execution list that corresponds to the block on which the simulation is paused, so you can track the position in the execution list alongside the location of the block in the model.
The Breakpoints List now has a button to open the Execution Order viewer.