Trace Faulty Signal Paths Using Model Slicer at Signal Breakpoints
You can use Model Slicer to trace faulty signal paths back to their sources when the
model simulation is paused at a breakpoint. Model Slicer creates an isolated debugging
environment for each breakpoint that allows you to focus only on the relevant portions
of your model. During the debugging session, you can add additional starting points to
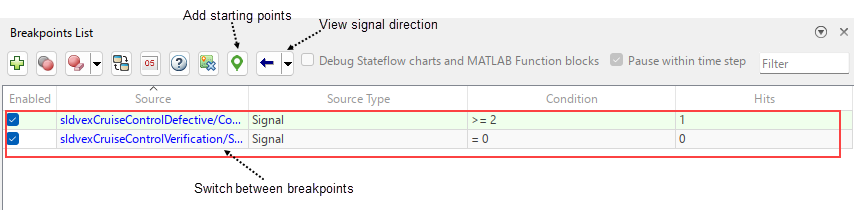
refine your analysis. To open Model Slicer, open the Breakpoints List and
select the breakpoint of interest. The Debug using Slicer button changes from ![]() to
to ![]() when the model simulation is paused on a breakpoint.
For more information, see Breakpoints List.
when the model simulation is paused on a breakpoint.
For more information, see Breakpoints List.
Using Model Slicer from the Breakpoints List, you can:
Add and trace multiple signal breakpoints during the debug session. When you add another breakpoint, Model Slicer creates a separate Model Slicer configuration that is completely different from previous Model Slicer configuration.
Change between the breakpoints you were debugging earlier by selecting a different breakpoint from the Breakpoints List. This automatically toggles the slice configuration to the earlier breakpoint that was already set when you started debugging.
Add additional starting points by selecting a block or signal from the Simulink® canvas.
Switch the highlight direction of the signal by using upstream, downstream or bidirectional arrow buttons.
Note
To open Model Slicer from Breakpoints List, a Simulink Check™ license is required.
Debug Run-Time Errors Using Model Slicer
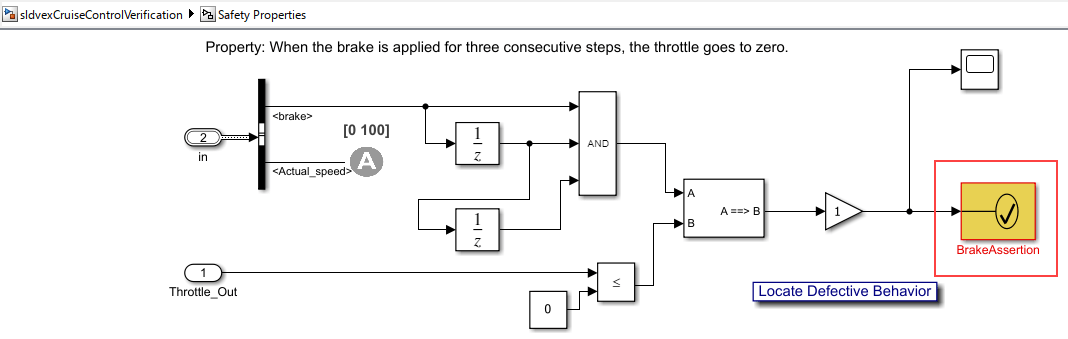
This example shows how to set a breakpoint on the signal and use Model Slicer from Breakpoints List to highlight and debug run-time errors in a model. The model contains a safety property with an assertion block which causes a simulation error. You can set up a breakpoint on the signal when the model is paused during simulation and use Model Slicer to debug the error. For more information, see Breakpoints List.
Open Model and Run Simulation
Open the model sldvexCruiseControlVerification.
open_system ("sldvexCruiseControlVerification")The model contains an Assertion block named BrakeAssertion that leads to an assertion.
In the Simulink Toolstrip, on the Debug tab, click Run ![]() to simulate the model.
to simulate the model.
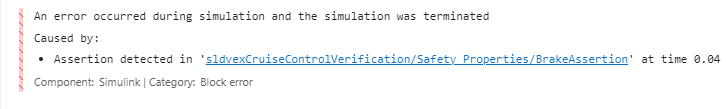
The BrakeAssertion block causes the simulation to terminate and produces an error.
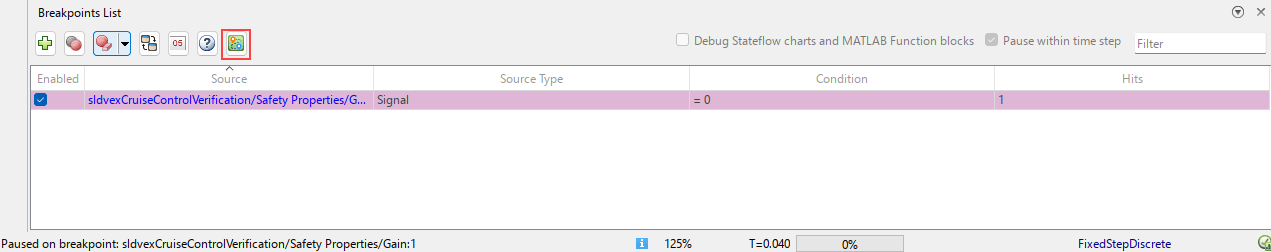
Add Breakpoints and Run Simulation
Set a breakpoint such that the input to the BrakeAssertion block is false:
1. Select the input signal to the BrakeAssertion block.
2. On the Debug tab, in the Breakpoints section, click Add Breakpoint. The Add Breakpoint dialog box opens.
3. In the Add Breakpoint dialog box, select a condition and value so that the simulation pauses when the input signal is equal to zero. From the condition drop-down list, select == and specify the value as 0. Click OK.
A red circle appears on the line for the input signal to BrakeAssertion to indicate that the signal has an enabled breakpoint.
To avoid the assertion while debugging the simulation, comment out the Assertion block BrakeAssertion.
Double-click the assertion block and clear Stop simulation when assertion fails. From the Debug tab, click Run to debug the simulation. The model pauses when the output of the gain block is equal to 0.
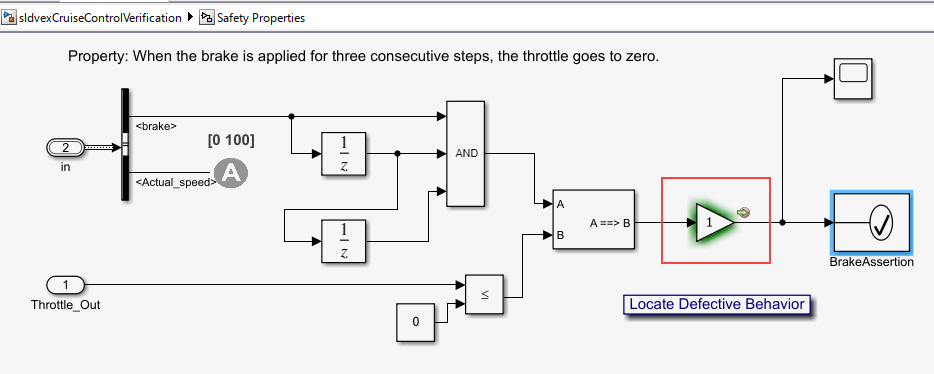
To open the Breakpoints List, click the breakpoint in the model canvas, or in the Simulink® Toolstrip, on the Debug tab, click Breakpoints List. The Breakpoints List opens with the Debug using Slicer button ![]() .
.
Debug Using Model Slicer
Click the Debug using Slicer button ![]() to open the Model Slicer and highlight from the breakpoint. When open, Model Slicer automatically adds the starting points and port value labels from the breakpoint.
to open the Model Slicer and highlight from the breakpoint. When open, Model Slicer automatically adds the starting points and port value labels from the breakpoint.
The Implies block lets you specify a condition to produce a given response. For example, If A is true, B is false, A ==> B is false, the model pauses at the breakpoint. The condition A ==> B in the Implies block is false when you apply the brake input for three consecutive time steps. This causes the throttle to go back to zero and induces the assertion from the BrakeAssertion block.
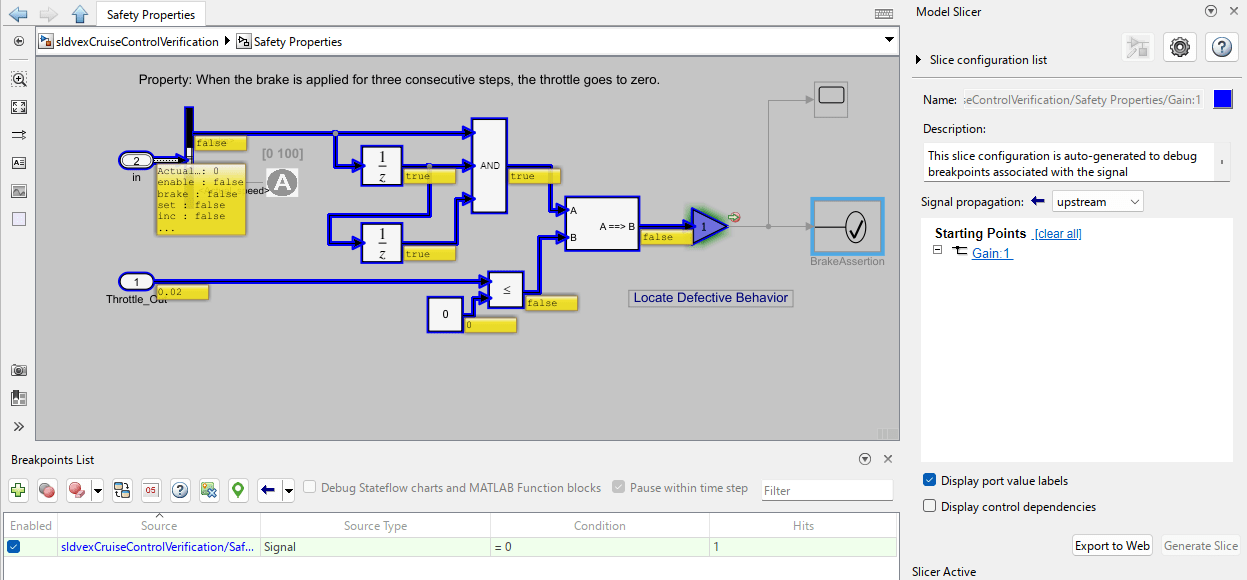
Use the highlighted signals to trace the input A back to its source.
1. Right-click on the AND block and from the Model Slicer app section, click the Add as Exclusion Point button ![]() . This limits the highlighting and analysis to only the parts of the model you want to investigate.
. This limits the highlighting and analysis to only the parts of the model you want to investigate.
2. Navigate inside the Controller to trace the throttle signal to its source, which is the PI Controller block.
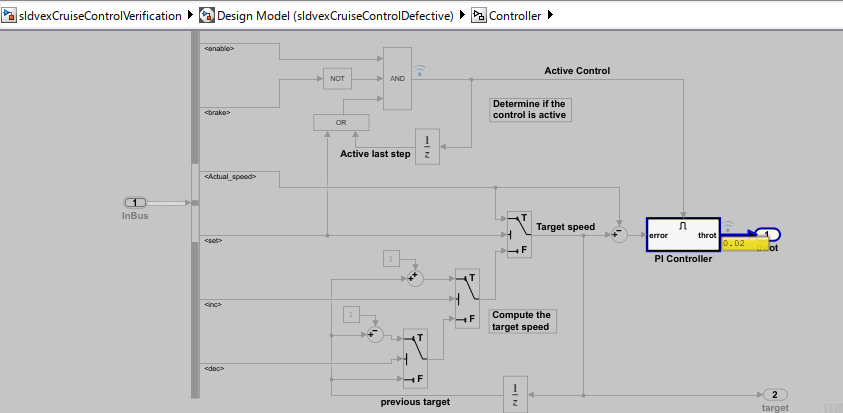
3. Step the simulation back to the first time step. Make sure you enable stepping back in the simulation before you start the simulation. On the Debug tab, click Step Back three times, until T = 0.00. At the start of the simulation, the output of PI Controller block is 0.
4. Advance the simulation to T = 0.010 by clicking Step Forward. The throttle value updates to 0.02. Continue to T = 0.020. The PI Controller block maintains its output value at 0.02, and the highlighting disappears.
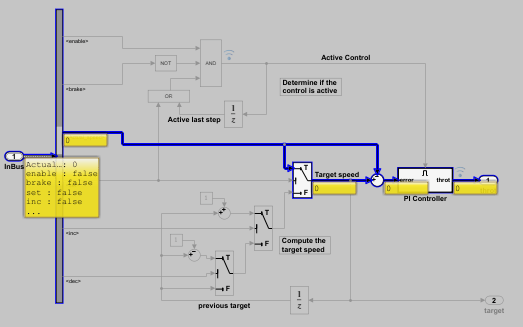
You can enable the control dependencies to see if the PI controller is enabled or not during a time step. The PI Controller block is not enabled at the simulation time (0.20). Additionally, observe that the port value label on the Active Control input to the PI Controller displays false.
5. Step forward two times to T = 0.040 and the input to the PI Controller remains false.
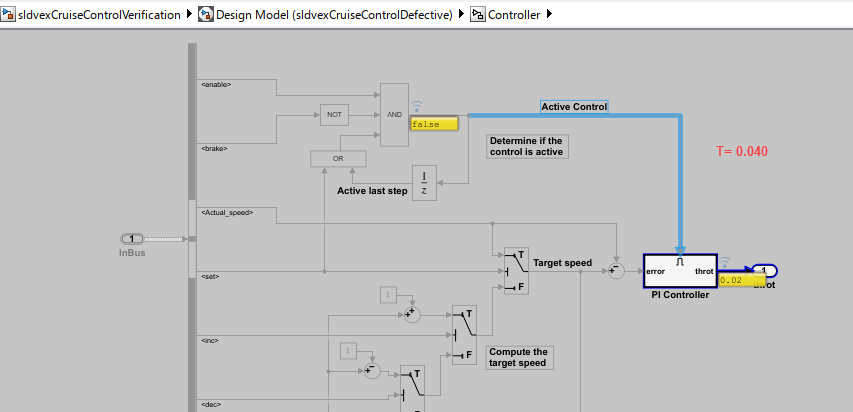
This indicates that the throt output is configured to hold its output when it is disabled, which is the modeling error that results in faulty behavior of signals.
Incorporate the Fix
1. Exit the session by clicking Close Model Slicer button ![]() and stop the simulation.
and stop the simulation.
2. Open the model and go to sldvexCruiseControlVerification/Design Model/Controller/PI Controller. Double click the throt output to open the Block parameters dialog box. Set Output when disabled to value to reset. Click Apply and OK.
3. Save the model. Run the simulation. Observe that the simulation runs without any warnings.
Considerations and Limitations
Use of Model Slicer from the Breakpoints List is supported when:
The simulation runs in normal mode.
The simulation is paused on a signal breakpoint.
Tracing paths from signal breakpoints with Model Slicer is not preserved when you exit the debugging session.