quinticpolytraj
5 次軌跡の生成
構文
説明
例
一連の 2 次元 "xy" ウェイポイントを指定して、関数 quinticpolytraj を使用します。ウェイポイントの時間点も指定します。
wpts = [1 4 4 3 -2 0; 0 1 2 4 3 1];
tpts = 0:5;
軌跡をサンプリングする時間ベクトルを指定します。指定した時間点よりも短い間隔でサンプリングします。
tvec = 0:0.01:5;
5 次軌跡を計算します。関数は、5 次多項式の軌跡の位置 (q)、速度 (qd)、加速度 (qdd)、および多項式係数 (pp) を出力します。
[q,qd,qdd,pp] = quinticpolytraj(wpts,tpts,tvec);
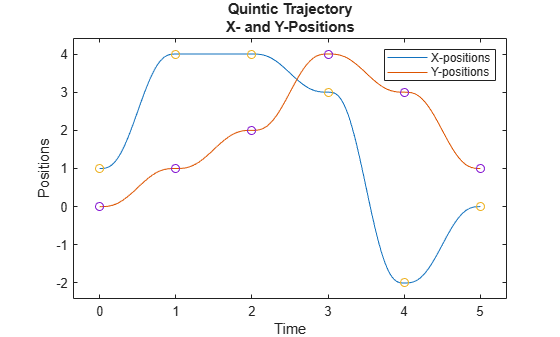
"x" 位置および "y" 位置の 5 次軌跡をプロットします。軌跡を各ウェイポイントと比較します。
plot(tvec,q)
hold on
scatter(tpts,wpts)
xlabel("Time")
ylabel("Positions")
legend("X-positions","Y-positions")
title(["Quintic Trajectory","X- and Y-Positions"])
axis padded
hold off
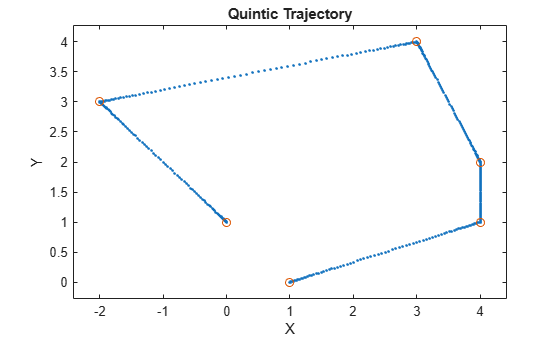
2 次元平面における実際の位置も確認できます。q ベクトルとウェイポイントの個別の行を、"x" 位置および "y" 位置としてプロットします。
figure
plot(q(1,:),q(2,:),".",LineWidth=0.10)
hold on
scatter(wpts(1,:),wpts(2,:))
xlabel("X")
ylabel("Y")
title("Quintic Trajectory")
axis padded
hold off
入力引数
名前と値の引数
出力引数
拡張機能
バージョン履歴
R2019a で導入