view
回帰木の表示
説明
例
学習済み回帰木をテキストおよびグラフィックスで表示します。
carsmall データ セットを読み込みます。重量 (Weight) と気筒数 (Cylinders) を使用して自動車の燃費 (MPG) を説明するモデルを考えます。
load carsmall
X = [Weight Cylinders];
Y = MPG;
すべての測定値を使用して回帰木に学習させます。
Mdl = fitrtree(X,Y);
学習済み回帰木をテキストで表示します。
view(Mdl)
Decision tree for regression
 1  if x1<3085.5 then node 2 elseif x1>=3085.5 then node 3 else 23.7181
 2  if x1<2371 then node 4 elseif x1>=2371 then node 5 else 28.7931
 3  if x2<7 then node 6 elseif x2>=7 then node 7 else 15.5417
 4  if x1<2162 then node 8 elseif x1>=2162 then node 9 else 32.0741
 5  if x2<5 then node 10 elseif x2>=5 then node 11 else 25.9355
 6  fit = 19.2778
 7  if x1<4381 then node 12 elseif x1>=4381 then node 13 else 14.2963
 8  if x1<1951 then node 14 elseif x1>=1951 then node 15 else 33.3056
 9  fit = 29.6111
10  if x1<2827.5 then node 16 elseif x1>=2827.5 then node 17 else 27.2143
11  if x1<3013.5 then node 18 elseif x1>=3013.5 then node 19 else 23.25
12  if x1<3533.5 then node 20 elseif x1>=3533.5 then node 21 else 14.8696
13  fit = 11
14  fit = 29.375
15  if x1<2142.5 then node 22 elseif x1>=2142.5 then node 23 else 34.4286
16  if x1<2385 then node 24 elseif x1>=2385 then node 25 else 27.6389
17  fit = 24.6667
18  fit = 21.5
19  fit = 30.25
20  fit = 16.6
21  if x1<4378 then node 26 elseif x1>=4378 then node 27 else 14.3889
22  if x1<2080 then node 28 elseif x1>=2080 then node 29 else 34.8333
23  fit = 32
24  fit = 24.5
25  if x1<2412.5 then node 30 elseif x1>=2412.5 then node 31 else 28.0313
26  if x1<4365 then node 32 elseif x1>=4365 then node 33 else 14.2647
27  fit = 16.5
28  fit = 34.125
29  fit = 36.25
30  fit = 34
31  if x1<2447 then node 34 elseif x1>=2447 then node 35 else 27.6333
32  if x1<4122.5 then node 36 elseif x1>=4122.5 then node 37 else 14.5313
33  fit = 10
34  fit = 24
35  if x1<2573.5 then node 38 elseif x1>=2573.5 then node 39 else 27.8929
36  if x1<3860 then node 40 elseif x1>=3860 then node 41 else 14.15
37  fit = 15.1667
38  fit = 27.125
39  if x1<2580 then node 42 elseif x1>=2580 then node 43 else 28.2
40  fit = 14.5
41  fit = 13.625
42  fit = 31
43  fit = 27.8889
学習済み回帰木をグラフィックスで表示します。
view(Mdl,Mode="graph");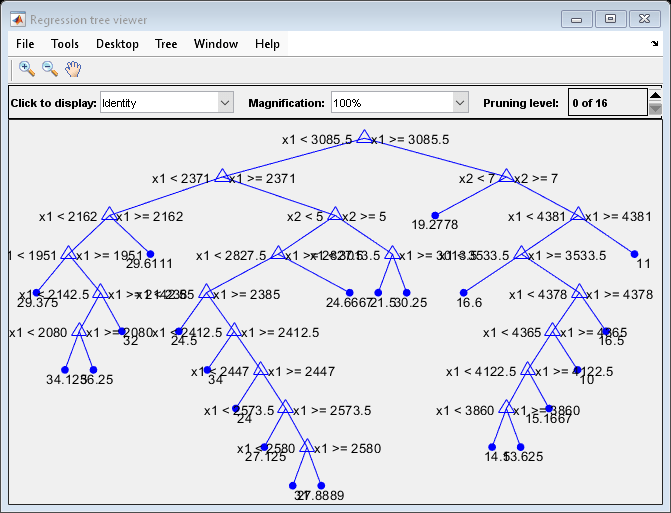
carsmall データ セットを読み込みます。重量 (Weight) と気筒数 (Cylinders) を使用して自動車の燃費 (MPG) を説明するモデルを考えます。
load carsmall
X = [Weight Cylinders];
Y = MPG;
すべての測定値を使用して 100 本の回帰木の bag を成長させます。
rng(1) % For reproducibility
Mdl = TreeBagger(100,X,Y);または、fitrensembleを使用して回帰木の bag を成長させることもできます。
Mdl はTreeBaggerモデル オブジェクトです。Mdl.Trees は、100 本の学習済み回帰木の bag を 100 行 1 列の cell 配列に格納します。つまり、Mdl.Trees の各セルに CompactRegressionTree モデル オブジェクトが格納されます。
bag 内の 10 番目の回帰木のグラフを表示します。
Tree10 = Mdl.Trees{10};
view(Tree10,'Mode','graph');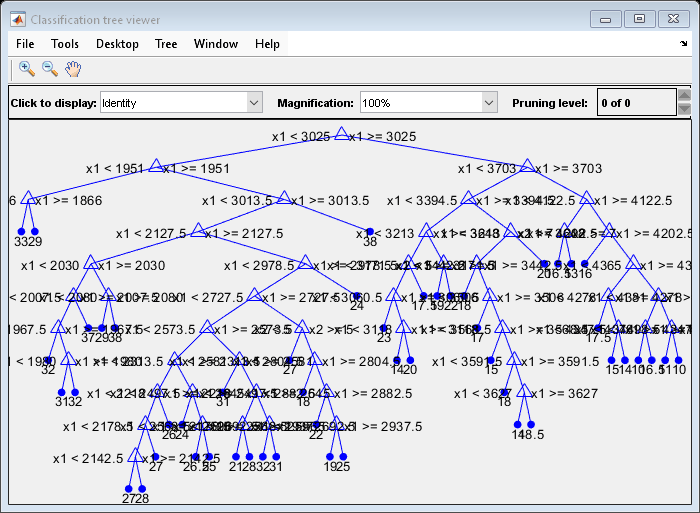
既定の設定では、bag of trees に対して木を深く成長させます。
carsmall データ セットを読み込みます。重量 (Weight) と気筒数 (Cylinders) を使用して自動車の燃費 (MPG) を説明するモデルを考えます。
load carsmall
X = [Weight Cylinders];
Y = MPG;
すべての測定値を使用して 100 本の回帰木のアンサンブルをブースティングします。
Mdl = fitrensemble(X,Y,'Method','LSBoost');
Mdl はRegressionEnsembleモデル オブジェクトです。Mdl.Trained は、100 本の学習済み回帰木のアンサンブルを 100 行 1 列の cell 配列に格納します。つまり、Mdl.Trained の各セルに CompactRegressionTree モデル オブジェクトが格納されます。
アンサンブル内の 10 番目の回帰木のグラフを表示します。
Tree10 = Mdl.Trained{10};
view(Tree10,'Mode','graph');
既定の設定では、fitrensemble は木のブースティング アンサンブルに対して浅い木を成長させます。つまり、'Learners' は templateTree('MaxNumSplits',10) になります。
入力引数
ヒント
木のアンサンブルの木 t を表示するには、次のコードのいずれかを入力します。
view(Ens.Trained{t})
view(Bag.Trees{t})Ensは、fitrensembleによって返された完全なアンサンブルまたはcompactによって返されたコンパクトなアンサンブルです。Bagは、TreeBaggerによって返された完全な bag of trees またはcompactによって返されたコンパクトな bag of trees です。
コマンド ウィンドウで tree を保存するには、関数 findall および setdiff を使用して Figure のハンドルを取得し、関数 saveas を使用して tree を保存します。
before = findall(groot,Type="figure"); % Find all figures
view(Mdl,Mode="graph")
after = findall(groot,Type="figure");
h = setdiff(after,before); % Get the figure handle of the tree viewer
saveas(h,"a.png")