Main Content

モデル固有の異常検出

Statistics and Machine Learning Toolbox™ には、分類モデル、回帰モデル、またはクラスタリング モデルに学習させた後に適用できるモデル固有の異常検出機能が用意されています。たとえば、次のオブジェクト関数を使用して異常を検出できます。

  • 近接行列 — ランダム フォレスト (CompactTreeBagger) の outlierMeasure

  • マハラノビス距離 — 判別分析分類器 (ClassificationDiscriminant) の mahal、混合ガウス モデル (gmdistribution) の mahal

  • 条件なし確率密度 — 判別分析分類器 (ClassificationDiscriminant) の logp、単純ベイズ分類器 (ClassificationNaiveBayes) の logp、インクリメンタル学習用の単純ベイズ分類器 (incrementalClassificationNaiveBayes) の logp

詳細については、関数のリファレンス ページを参照してください。

ランダム フォレストに学習させた後の外れ値の検出

関数TreeBaggerを使用してランダム フォレスト分類器に学習させ、オブジェクト関数outlierMeasureを使用して学習データの外れ値を検出します。

ランダム フォレスト分類器の学習

ionosphere データ セットを読み込みます。これには、レーダー反射の品質 (Y) と 34 個の変数の予測子データ (X) が含まれています。レーダー反射の品質は良好 ('g') または不良 ('b') のいずれかです。

load ionosphere

ランダム フォレスト分類器に学習させます。予測子の重要度の推定に関する out-of-bag 情報を格納します。

rng("default") % For reproducibility
Mdl_TB = TreeBagger(100,X,Y,Method="classification", ...
    OOBPredictorImportance="on");

Mdl_TB は分類用のTreeBaggerモデル オブジェクトです。TreeBagger は、予測子の重要度の推定を OOBPermutedPredictorDeltaError プロパティに格納します。

近接度を使用した外れ値の検出

関数 outlierMeasure を使用して学習データの外れ値を検出します。この関数は、学習済みランダム フォレスト内の観測値間の近接度の平均二乗に基づいて外れ値の尺度を計算します。

CMdl_TB = compact(Mdl_TB);
s_proximity = outlierMeasure(CMdl_TB,X,Labels=Y);

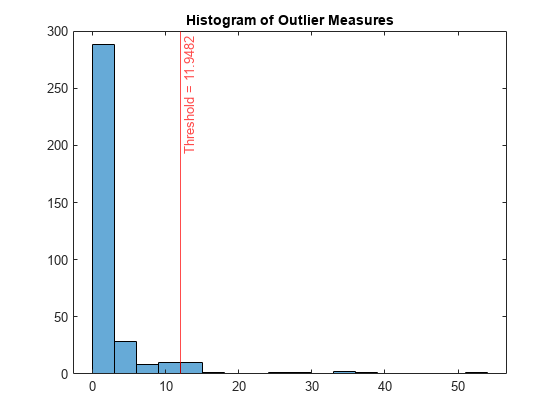
外れ値の尺度の高い値はその観測値が外れ値であることを示します。関数isoutlierを使用して、95 番目の百分位数に対応するしきい値を調べて外れ値を識別します。

[TF,~,U] = isoutlier(s_proximity,Percentiles=[0 95]);

外れ値の尺度のヒストグラムをプロットします。外れ値のしきい値の位置に垂直線を作成します。

histogram(s_proximity)
xline(U,"r-",join(["Threshold =" U]))
title("Histogram of Outlier Measures")

Figure contains an axes object. The axes object with title Histogram of Outlier Measures contains 2 objects of type histogram, constantline.

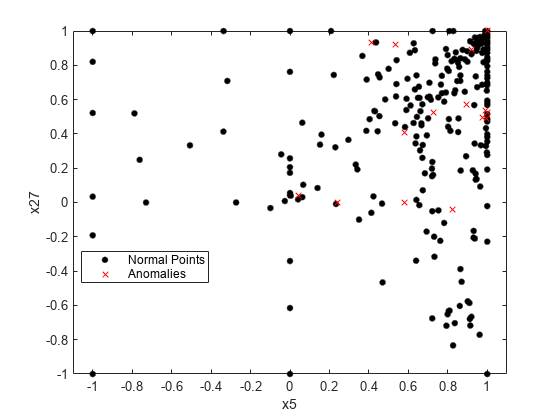
OOBPermutedPredictorDeltaError プロパティに含まれる予測子の重要度の推定で選択された最も重要な 2 つの特徴量を使用して観測値を可視化します。

[~,idx] = sort(Mdl_TB.OOBPermutedPredictorDeltaError,'descend');
TF_c = categorical(TF,[0 1],["Normal Points" "Anomalies"]);
gscatter(X(:,idx(1)),X(:,idx(2)),TF_c,"kr",".x",[],"on", ...
    Mdl_TB.PredictorNames(idx(1)),Mdl_TB.PredictorNames(idx(2)))

Figure contains an axes object. The axes object with xlabel x5, ylabel x27 contains 2 objects of type line. One or more of the lines displays its values using only markers These objects represent Normal Points, Anomalies.

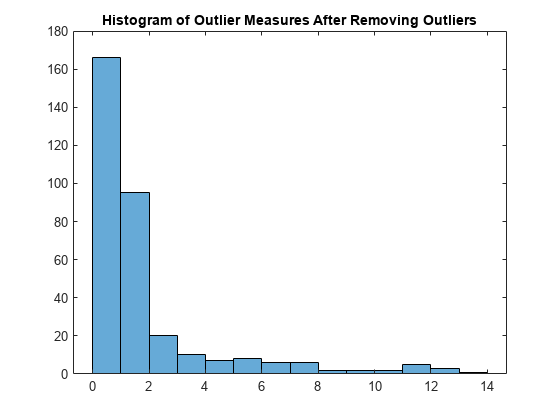
外れ値を除いて分類器にもう一度学習させ、外れ値の尺度のヒストグラムをプロットします。

Mdl_TB = TreeBagger(100,X(~TF,:),Y(~TF),Method="classification");
s_proximity = outlierMeasure(CMdl_TB,X(~TF,:),Labels=Y(~TF));
histogram(s_proximity)
title("Histogram of Outlier Measures After Removing Outliers")

Figure contains an axes object. The axes object with title Histogram of Outlier Measures After Removing Outliers contains an object of type histogram.

判別分析分類器に学習させた後の外れ値の検出

関数fitcdiscrを使用して判別分析モデルに学習させ、オブジェクト関数logpおよびmahalを使用して学習データの外れ値を検出します。

判別分析モデルの学習

フィッシャーのアヤメのデータ セットを読み込みます。行列 meas には、150 種類の花についての測定値が格納されています。変数 species には、それぞれの花の種類がリストされています。

load fisheriris

データ セット全体を使用して、判別分析モデルに学習をさせます。

Mdl = fitcdiscr(meas,species,PredictorNames= ...
    ["Sepal Length" "Sepal Width" "Petal Length" "Petal Width"]);

MdlClassificationDiscriminant モデルです。

対数条件なし確率密度を使用した外れ値の検出

学習データの対数条件なし確率密度を計算します。

s_logp = logp(Mdl,meas);

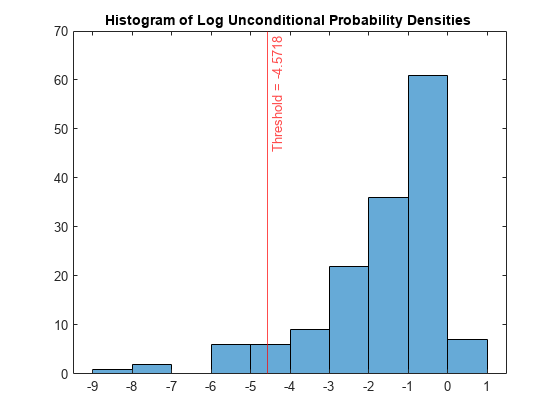
密度の値が低ければ、対応する観測値が外れ値であることを示します。

関数isoutlierを使用して、外れ値の密度の下限のしきい値を調べます。

[~,L_logp] = isoutlier(s_logp);

しきい値を使用して外れ値を識別します。

TF_logp = s_logp < L_logp;

密度の値のヒストグラムをプロットします。外れ値のしきい値の位置に垂直線を作成します。

figure
histogram(s_logp)
xline(L_logp,"r-",join(["Threshold =" L_logp]))
title("Histogram of Log Unconditional Probability Densities ")

Figure contains an axes object. The axes object with title Histogram of Log Unconditional Probability Densities contains 2 objects of type histogram, constantline.

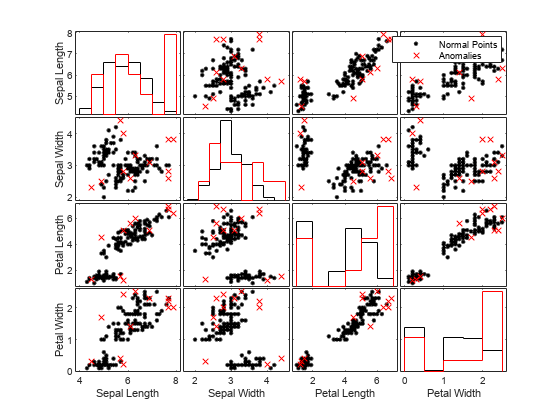
正常な点の観測値と異常の観測値を比較するために、関数gplotmatrixを使用して、変数の組み合わせごとにグループ化されたヒストグラムとグループ化された散布図の行列を作成します。

TF_logp_c = categorical(TF_logp,[0 1],["Normal Points" "Anomalies"]);
gplotmatrix(meas,[],TF_logp_c,"kr",".x",[],[],[],Mdl.PredictorNames)

Figure contains 16 axes objects. Axes object 1 with xlabel Sepal Length, ylabel Petal Width contains 2 objects of type line. One or more of the lines displays its values using only markers Axes object 2 with xlabel Sepal Width contains 2 objects of type line. One or more of the lines displays its values using only markers Axes object 3 with xlabel Petal Length contains 2 objects of type line. One or more of the lines displays its values using only markers Axes object 4 with xlabel Petal Width contains 2 objects of type line. Axes object 5 with ylabel Petal Length contains 2 objects of type line. One or more of the lines displays its values using only markers Axes object 6 contains 2 objects of type line. One or more of the lines displays its values using only markers Axes object 7 contains 2 objects of type line. Axes object 8 contains 2 objects of type line. One or more of the lines displays its values using only markers Axes object 9 with ylabel Sepal Width contains 2 objects of type line. One or more of the lines displays its values using only markers Axes object 10 contains 2 objects of type line. Axes object 11 contains 2 objects of type line. One or more of the lines displays its values using only markers Axes object 12 contains 2 objects of type line. One or more of the lines displays its values using only markers Axes object 13 with ylabel Sepal Length contains 2 objects of type line. Axes object 14 contains 2 objects of type line. One or more of the lines displays its values using only markers Axes object 15 contains 2 objects of type line. One or more of the lines displays its values using only markers Axes object 16 contains 2 objects of type line. One or more of the lines displays its values using only markers These objects represent Normal Points, Anomalies.

マハラノビス距離を使用した外れ値の検出

学習データから真のラベルのクラス平均までのマハラノビス平方距離を調べます。

s_mahal = mahal(Mdl,meas,ClassLabels=species);

距離の値が大きければ、対応する観測値が外れ値であることを示します。

関数 isoutlier を使用して、95 番目の百分位数に対応するしきい値を調べて外れ値を識別します。

[TF_mahal,~,U_mahal] = isoutlier(s_mahal,Percentiles=[0 95]);

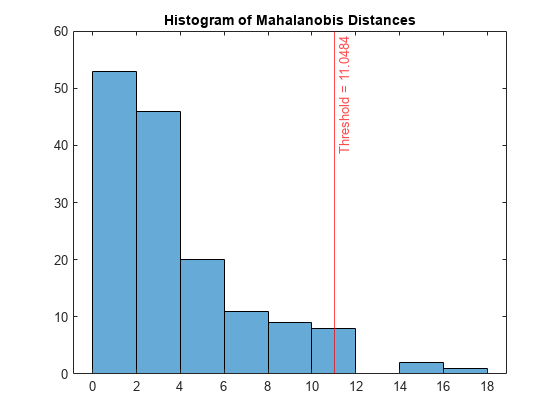
距離のヒストグラムをプロットします。外れ値のしきい値の位置に垂直線を作成します。

figure
histogram(s_mahal)
xline(U_mahal,"-r",join(["Threshold =" U_mahal]))
title("Histogram of Mahalanobis Distances")

Figure contains an axes object. The axes object with title Histogram of Mahalanobis Distances contains 2 objects of type histogram, constantline.

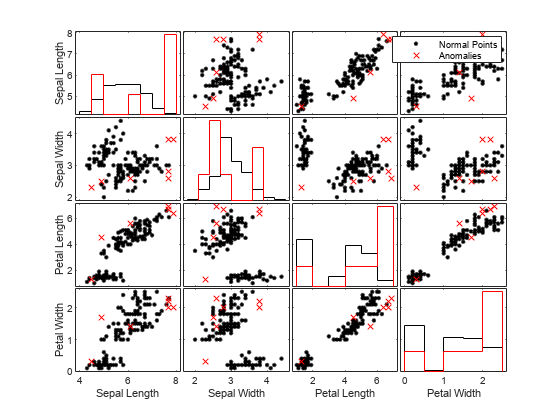
関数gplotmatrixを使用して、正常な点の観測値と異常の観測値を比較します。

TF_mahal_c = categorical(TF_mahal,[0 1],["Normal Points" "Anomalies"]);
gplotmatrix(meas,[],TF_mahal_c,"kr",".x",[],[],[],Mdl.PredictorNames)

Figure contains 16 axes objects. Axes object 1 with xlabel Sepal Length, ylabel Petal Width contains 2 objects of type line. One or more of the lines displays its values using only markers Axes object 2 with xlabel Sepal Width contains 2 objects of type line. One or more of the lines displays its values using only markers Axes object 3 with xlabel Petal Length contains 2 objects of type line. One or more of the lines displays its values using only markers Axes object 4 with xlabel Petal Width contains 2 objects of type line. Axes object 5 with ylabel Petal Length contains 2 objects of type line. One or more of the lines displays its values using only markers Axes object 6 contains 2 objects of type line. One or more of the lines displays its values using only markers Axes object 7 contains 2 objects of type line. Axes object 8 contains 2 objects of type line. One or more of the lines displays its values using only markers Axes object 9 with ylabel Sepal Width contains 2 objects of type line. One or more of the lines displays its values using only markers Axes object 10 contains 2 objects of type line. Axes object 11 contains 2 objects of type line. One or more of the lines displays its values using only markers Axes object 12 contains 2 objects of type line. One or more of the lines displays its values using only markers Axes object 13 with ylabel Sepal Length contains 2 objects of type line. Axes object 14 contains 2 objects of type line. One or more of the lines displays its values using only markers Axes object 15 contains 2 objects of type line. One or more of the lines displays its values using only markers Axes object 16 contains 2 objects of type line. One or more of the lines displays its values using only markers These objects represent Normal Points, Anomalies.

参考

| | | | | |

関連するトピック