メインコンテンツ

gplotmatrix

R2026b

グループ別散布図の行列

説明

gplotmatrix(X,[],group) は、group 内のグループ化変数によってグループ化された X 内のデータの散布図およびヒストグラムの行列を作成します。生成される Figure 内の対角線外の各図は、X の他の列に対する X の列の散布図です。また、グループ化されたヒストグラムの輪郭は、プロット行列の対角線上の図にプロットされます。X と group の行数は同じでなければなりません。

例

gplotmatrix(X,Y,group) は、散布図の行列を作成します。結果となる Figure 内に含まれる図は、Y の列に対する X の列の散布図です。たとえば、X に p 列があり、Y に q 列がある場合、Figure は散布図の q 行 p 列の行列を含みます。すべてのプロットは、グループ化変数 group ごとにグループ化されます入力引数 X、Y および group の行数はすべて同じでなければなりません。

例

gplotmatrix(X,Y,group,clr,sym,siz) は、各グループのマーカーの色 clr、記号 sym、およびサイズ siz を指定します。

gplotmatrix(X,Y,group,clr,sym,siz,doleg) は、凡例を Figure に表示するかどうかを制御します。既定では、gplotmatrix は凡例を作成します。

gplotmatrix(X,[],group,clr,sym,siz,doleg,dispopt) は、X のプロット行列内にある対角線上の図の表示オプションを制御します。

gplotmatrix(X,[],group,clr,sym,siz,doleg,dispopt,xnam) は、xnam で指定された列名を使用して、散布図の x 軸と y 軸にラベルを付けます。入力引数 xnam には X の各列ごとに 1 つの名前を含めなければなりません。dispopt を 'variable' に設定し、散布図行列の対角線に沿って変数名を表示します。

例

gplotmatrix(X,Y,group,clr,sym,siz,doleg,[],xnam,ynam) は、xnam と ynam で指定された列名を使用して、散布図の x 軸と y 軸にラベルを付けます。入力引数 xnam と ynam には、それぞれ X と Y の各列ごとに 1 つの名前を含めなければなりません。

例

gplotmatrix(parent,___) は、parent によって指定された Figure またはパネル内に散布図行列を作成します。parent を最初の入力引数として指定し、その後に上記の構文での入力引数の組み合わせが続きます。

[h,ax,bigax] = gplotmatrix(___) は、個々の図および散布図行列全体へのグラフィックス ハンドルを返します。

clr、sym、siz、doleg および dispopt について [] を渡すと、既定値を使用できます。

例

例

すべて折りたたむ

データ セット内の変数の各組み合わせについて散布図の行列を作成します。別々の変数に従ってデータをグループ化します。

花のデータを含む fisheriris データ セットを読み込みます。meas の 4 つの列は、花のがく片の長さ、がく片の幅、花弁の長さ、花弁の幅です。species には setosa、versicolor、virginica の花の種の名前が含まれます。花の種全体の花の測定値を視覚的に比較します。

load fisheriris
gplotmatrix(meas,[],species)
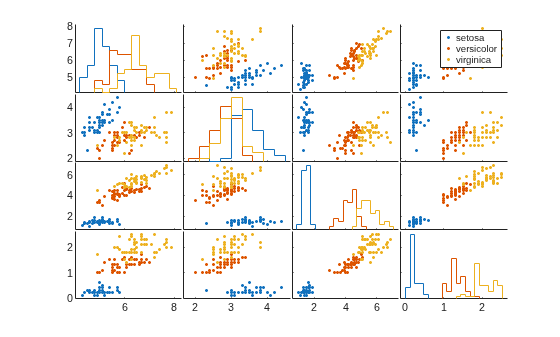
Figure contains 20 axes objects. Axes object 1 contains 3 objects of type line. One or more of the lines displays its values using only markers Axes object 2 contains 3 objects of type line. One or more of the lines displays its values using only markers Axes object 3 contains 3 objects of type line. One or more of the lines displays its values using only markers Axes object 4 contains 3 objects of type line. Axes object 5 contains 3 objects of type line. One or more of the lines displays its values using only markers Axes object 6 contains 3 objects of type line. One or more of the lines displays its values using only markers Axes object 7 contains 3 objects of type line. Axes object 8 contains 3 objects of type line. One or more of the lines displays its values using only markers Axes object 9 contains 3 objects of type line. One or more of the lines displays its values using only markers Axes object 10 contains 3 objects of type line. Axes object 11 contains 3 objects of type line. One or more of the lines displays its values using only markers Axes object 12 contains 3 objects of type line. One or more of the lines displays its values using only markers Axes object 13 contains 3 objects of type line. Axes object 14 contains 3 objects of type line. One or more of the lines displays its values using only markers Axes object 15 contains 3 objects of type line. One or more of the lines displays its values using only markers Axes object 16 contains 3 objects of type line. One or more of the lines displays its values using only markers These objects represent setosa, versicolor, virginica. Hidden axes object 17 contains 3 objects of type histogram. Hidden axes object 18 contains 3 objects of type histogram. Hidden axes object 19 contains 3 objects of type histogram. Hidden axes object 20 contains 3 objects of type histogram.

散布図の行列では、散布図の一番左の列の x 軸は meas の先頭列のがく片の長さに対応します。同様に、散布図の一番下の行の y 軸は meas の最終列の花弁の幅に対応します。したがって、行列の左下の散布図は、(x 軸に沿う) がく片の長さの値を (y 軸に沿う) 花弁の幅の値と比較しています。各点の色は、花の種により異なります。

対角線上の図は散布図ではなくヒストグラムです。たとえば、行列の左上のプロットは、花の種それぞれのがく片の長さの分布を示します。

データ セット内の変数のサブセットを別の変数のサブセットと比較する散布図を作成します。別々の変数に従ってデータをグループ化します。

discrim データ セットを読み込みます。

load discrim

ratings 配列には、categories 配列にある 9 種類のカテゴリについて、アメリカ合衆国の 329 都市を評価した値が含まれています。group 配列には、都市の規模を示すコードが含まれています。上位の 26 都市は 2、それ以外の都市は 1 です。

最初の 2 つのカテゴリ (climate および housing) と 4 番目と 7 番目のカテゴリ (crime および arts) を比較する散布図の行列を作成します。大規模な都市と小規模な都市のデータを視覚的に区別できるように、グループ化変数として group を指定します。

X = ratings(:,1:2);
Y = ratings(:,[4 7]);
gplotmatrix(X,Y,group)
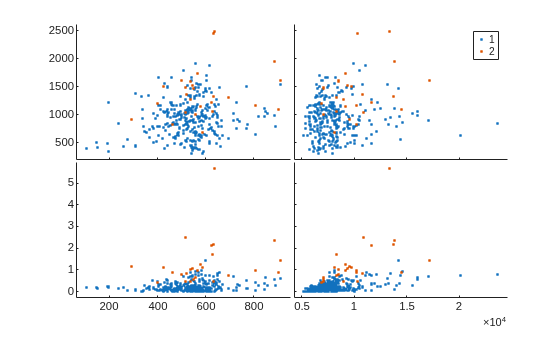
Figure contains 4 axes objects. Axes object 1 contains 2 objects of type line. One or more of the lines displays its values using only markers Axes object 2 contains 2 objects of type line. One or more of the lines displays its values using only markers Axes object 3 contains 2 objects of type line. One or more of the lines displays its values using only markers Axes object 4 contains 2 objects of type line. One or more of the lines displays its values using only markers These objects represent 1, 2.

散布図の行列は、指定した比較対象を、都市の規模を示すグループ別に色分けして表示します。

マーカーの色や記号を指定したり、座標軸に評価カテゴリのラベルを付けたりして、図の外観を見やすく調整します。

xnames = categories(1:2,:);
ynames = categories([4 7],:);
gplotmatrix(X,Y,group,'br','.o',[],'on',[],xnames,ynames)
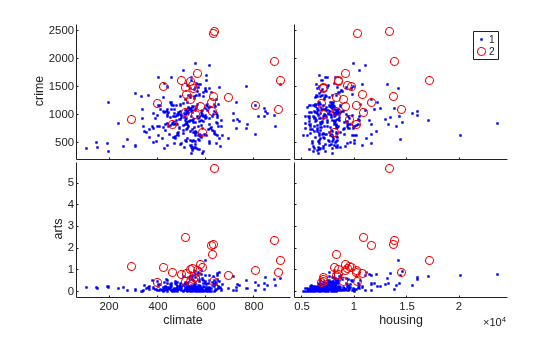
Figure contains 4 axes objects. Axes object 1 with xlabel climate, ylabel arts contains 2 objects of type line. One or more of the lines displays its values using only markers Axes object 2 with xlabel housing contains 2 objects of type line. One or more of the lines displays its values using only markers Axes object 3 with ylabel crime contains 2 objects of type line. One or more of the lines displays its values using only markers Axes object 4 contains 2 objects of type line. One or more of the lines displays its values using only markers These objects represent 1, 2.

2 つのグループ化変数を使用して、データ変数を比較する散布図の行列を作成します。

patients データ セットを読み込みます。患者の拡張期および収縮期の血圧の値を比較します。性別および喫煙者の現状によって患者をグループ化します。Smoker をカテゴリカル変数に変換し、より説明的なラベルを凡例に設定します。'grpbars' 表示オプションを使用して、グループ化されたヒストグラムをプロット行列の対角線に沿って表示し、座標軸にラベルを付けます。

load patients
X = [Diastolic Systolic];
labeledSmoker = categorical(Smoker,[true false],{'Smoker','Nonsmoker'});
group = {Gender,labeledSmoker};
xnames = {'Diastolic','Systolic'};
gplotmatrix(X,[],group,[],[],[],[],'grpbars',xnames)
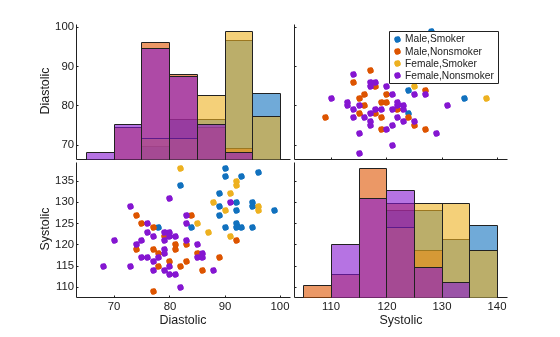
Figure contains 6 axes objects. Axes object 1 with xlabel Diastolic, ylabel Systolic contains 4 objects of type line. One or more of the lines displays its values using only markers Axes object 2 with xlabel Systolic contains 4 objects of type line. Axes object 3 with ylabel Diastolic contains 4 objects of type line. Axes object 4 contains 4 objects of type line. One or more of the lines displays its values using only markers These objects represent Male,Smoker, Male,Nonsmoker, Female,Smoker, Female,Nonsmoker. Hidden axes object 5 contains 4 objects of type histogram. Hidden axes object 6 contains 4 objects of type histogram.

たとえば、行列の左下の散布図は、喫煙者 (青および黄色のマーカー) は性別に関係なく、拡張期および収縮期の血圧の値が高くなる傾向があることを示します。

グループ化されたデータを表示する散布図の行列を作成します。1 つの散布図の外観を変更します。

carsmall データ セットを読み込みます。さまざまな自動車の測定値を使用して散布図行列を作成します。気筒数ごとに自動車をグループ化します。プロット行列の対角線に沿って自動車の変数名を表示します。タイトルをプロット行列に追加します。

load carsmall
X = [Acceleration Displacement Horsepower MPG Weight];
xnames = {'Acceleration','Displacement','Horsepower','MPG','Weight'};
[h,ax] = gplotmatrix(X,[],Cylinders,[],[],[],[],'variable',xnames);
title('Car Data')

Figure contains 25 axes objects. Axes object 1 contains 3 objects of type line. One or more of the lines displays its values using only markers Axes object 2 contains 3 objects of type line. One or more of the lines displays its values using only markers Axes object 3 contains 3 objects of type line. One or more of the lines displays its values using only markers Axes object 4 contains 3 objects of type line. One or more of the lines displays its values using only markers Axes object 5 contains an object of type text. Axes object 6 contains 3 objects of type line. One or more of the lines displays its values using only markers Axes object 7 contains 3 objects of type line. One or more of the lines displays its values using only markers Axes object 8 contains 3 objects of type line. One or more of the lines displays its values using only markers Axes object 9 contains an object of type text. Axes object 10 contains 3 objects of type line. One or more of the lines displays its values using only markers Axes object 11 contains 3 objects of type line. One or more of the lines displays its values using only markers Axes object 12 contains 3 objects of type line. One or more of the lines displays its values using only markers Axes object 13 contains an object of type text. Axes object 14 contains 3 objects of type line. One or more of the lines displays its values using only markers Axes object 15 contains 3 objects of type line. One or more of the lines displays its values using only markers Axes object 16 contains 3 objects of type line. One or more of the lines displays its values using only markers Axes object 17 contains an object of type text. Axes object 18 contains 3 objects of type line. One or more of the lines displays its values using only markers Axes object 19 contains 3 objects of type line. One or more of the lines displays its values using only markers Axes object 20 contains 3 objects of type line. One or more of the lines displays its values using only markers Axes object 21 contains an object of type text. Axes object 22 contains 3 objects of type line. One or more of the lines displays its values using only markers Axes object 23 contains 3 objects of type line. One or more of the lines displays its values using only markers Axes object 24 contains 3 objects of type line. One or more of the lines displays its values using only markers Axes object 25 contains 3 objects of type line. One or more of the lines displays its values using only markers These objects represent 4, 6, 8.

h と ax を使用して行列の左下の散布図の外観を変更します。最初に、散布図のデータ点の色を変更します。次に、グリッド ラインを散布図に追加します。

bottomleftPlot = h(5,1,:);
bottomleftPlot(1).Color = 'magenta';
bottomleftPlot(2).Color = 'green';
bottomleftPlot(3).Color = 'black';

bottomleftAxes = ax(5,1);
bottomleftAxes.XGrid = 'on';
bottomleftAxes.YGrid = 'on';
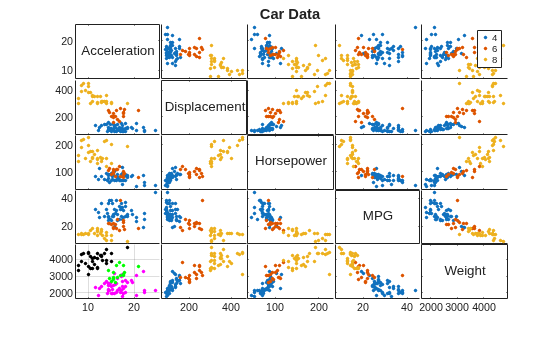
Figure contains 25 axes objects. Axes object 1 contains 3 objects of type line. One or more of the lines displays its values using only markers Axes object 2 contains 3 objects of type line. One or more of the lines displays its values using only markers Axes object 3 contains 3 objects of type line. One or more of the lines displays its values using only markers Axes object 4 contains 3 objects of type line. One or more of the lines displays its values using only markers Axes object 5 contains an object of type text. Axes object 6 contains 3 objects of type line. One or more of the lines displays its values using only markers Axes object 7 contains 3 objects of type line. One or more of the lines displays its values using only markers Axes object 8 contains 3 objects of type line. One or more of the lines displays its values using only markers Axes object 9 contains an object of type text. Axes object 10 contains 3 objects of type line. One or more of the lines displays its values using only markers Axes object 11 contains 3 objects of type line. One or more of the lines displays its values using only markers Axes object 12 contains 3 objects of type line. One or more of the lines displays its values using only markers Axes object 13 contains an object of type text. Axes object 14 contains 3 objects of type line. One or more of the lines displays its values using only markers Axes object 15 contains 3 objects of type line. One or more of the lines displays its values using only markers Axes object 16 contains 3 objects of type line. One or more of the lines displays its values using only markers Axes object 17 contains an object of type text. Axes object 18 contains 3 objects of type line. One or more of the lines displays its values using only markers Axes object 19 contains 3 objects of type line. One or more of the lines displays its values using only markers Axes object 20 contains 3 objects of type line. One or more of the lines displays its values using only markers Axes object 21 contains an object of type text. Axes object 22 contains 3 objects of type line. One or more of the lines displays its values using only markers Axes object 23 contains 3 objects of type line. One or more of the lines displays its values using only markers Axes object 24 contains 3 objects of type line. One or more of the lines displays its values using only markers Axes object 25 contains 3 objects of type line. One or more of the lines displays its values using only markers These objects represent 4, 6, 8.

既定の配色から、関数hsvによって決定される色にマーカーの色を変更します。

cereal データ セットを読み込みます。既定の配色を使用して、さまざまなシリアルの測定値の散布図行列を作成します。製造元ごとにシリアルをグループ化します。プロット行列の対角線に沿ってシリアルの変数名を表示します。

load cereal
X = [Sugars Carbo Sodium];
xnames = {'Sugars','Carbohydrates','Sodium'};
gplotmatrix(X,[],Mfg,[],[],[],[],'variable',xnames);
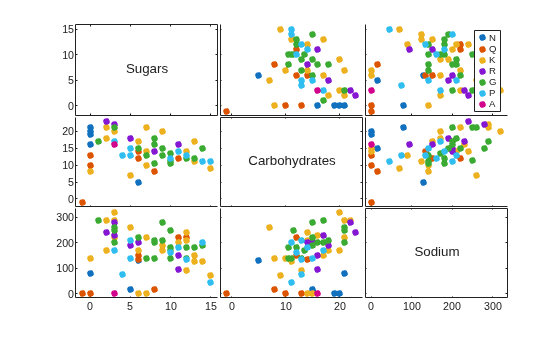
Figure contains 9 axes objects. Axes object 1 contains 7 objects of type line. One or more of the lines displays its values using only markers Axes object 2 contains 7 objects of type line. One or more of the lines displays its values using only markers Axes object 3 contains an object of type text. Axes object 4 contains 7 objects of type line. One or more of the lines displays its values using only markers Axes object 5 contains an object of type text. Axes object 6 contains 7 objects of type line. One or more of the lines displays its values using only markers Axes object 7 contains an object of type text. Axes object 8 contains 7 objects of type line. One or more of the lines displays its values using only markers Axes object 9 contains 7 objects of type line. One or more of the lines displays its values using only markers These objects represent N, Q, K, R, G, P, A.

関数hsvによって決定される色にマーカーの色を変更します。

numGroups = length(unique(Mfg));
clr = hsv(numGroups);
gplotmatrix(X,[],Mfg,clr,[],[],[],'variable',xnames);
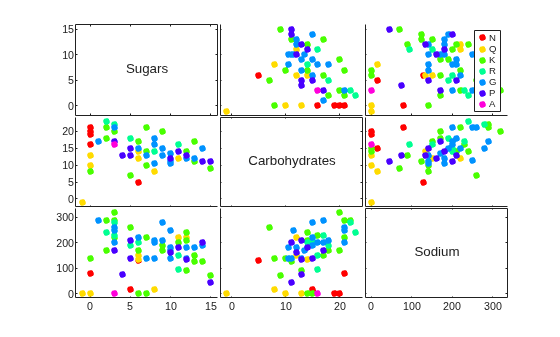
Figure contains 9 axes objects. Axes object 1 contains 7 objects of type line. One or more of the lines displays its values using only markers Axes object 2 contains 7 objects of type line. One or more of the lines displays its values using only markers Axes object 3 contains an object of type text. Axes object 4 contains 7 objects of type line. One or more of the lines displays its values using only markers Axes object 5 contains an object of type text. Axes object 6 contains 7 objects of type line. One or more of the lines displays its values using only markers Axes object 7 contains an object of type text. Axes object 8 contains 7 objects of type line. One or more of the lines displays its values using only markers Axes object 9 contains 7 objects of type line. One or more of the lines displays its values using only markers These objects represent N, Q, K, R, G, P, A.

入力引数

すべて折りたたむ

入力データ。n 行 p 列の数値行列、datetime 配列、または duration 配列を指定します。gplotmatrix は、X の列を使用してプロットの行列を作成します。追加の入力行列 Y を指定しない場合、gplotmatrix は p 行 p 列のプロットの行列を作成します。対角線外の図は散布図であり、対角線上の図は dispopt の値に応じて変化します。各散布図で、gplotmatrix は X の 1 つの列を X の別の列に対してプロットします。散布図の点は、group によってグループ化されます。

Y を指定すると、gplotmatrix は、X の p 個の列と Y の q 個の列を使用して q 行 p 列の散布図の行列を作成します。

データ型: single | double | datetime | duration

入力データ。n 行 q 列の数値行列、datetime 配列または duration 配列を指定します。gplotmatrix は、X の p 個の列と Y の q 個の列を使用して q 行 p 列の散布図の行列を作成します。プロット行列の各列について、散布図の x 軸の値は X の対応する列の値と同じです。同様に、プロット行列の各行について、散布図の y 軸の値は Y の対応する列の値と同じです。散布図の点は、group によってグループ化されます。

X と Y の行数は同じでなければなりません。

データ型: single | double | datetime | duration

グループ化変数。categorical ベクトル、数値ベクトル、logical ベクトル、文字配列、string 配列、または文字ベクトルの cell 配列を指定します。group は、いくつかのグループ化変数 ({g1 g2 g3} など) を含む cell 配列となることもあります。この場合、グループ化変数のすべてについて共通の値をもつ場合、観測は同じグループに属します。どのような場合でも、group は X と同じ行数でなければなりません。同じグループの点は、同じマーカーの色、記号およびサイズでグラフに表示されます。

例: categorical({'blue','red','yellow','blue','yellow','red','red','yellow','blue','red'})

例: {Smoker,Gender} (Smoker と Gender はグループ化変数)

データ型: categorical | single | double | logical | char | string | cell

マーカーの色。文字ベクトルまたは string スカラーによる色の省略名、または RGB 3 成分の行列を指定します。

カスタム色の場合は、RGB 3 成分の行列を指定します。RGB 3 成分は、色の赤、緑、青成分の強度を指定する 3 要素の行ベクトルです。強度は範囲 [0,1] に含まれていなければなりません。たとえば [0.4 0.6 0.7] のようになります。

あるいは、一部の一般的な色を名前で指定できます。次の表は、名前が付いた色のオプションおよび等価な RGB 3 成分の一覧です。

省略名RGB 3 成分外観
'r'[1 0 0]

Sample of the color red

'g'[0 1 0]

Sample of the color green

'b'[0 0 1]

Sample of the color blue

'c'[0 1 1]

Sample of the color cyan

'm'[1 0 1]

Sample of the color magenta

'y'[1 1 0]

Sample of the color yellow

'k'[0 0 0]

Sample of the color black

'w'[1 1 1]

Sample of the color white

次の表は、MATLAB が多くのタイプのプロットで使用する既定の色に対する RGB 3 成分のカラー コードの一覧です。

RGB 3 成分外観
[0 0.4470 0.7410]

Sample of RGB triplet [0 0.4470 0.7410], which appears as dark blue

[0.8500 0.3250 0.0980]

Sample of RGB triplet [0.8500 0.3250 0.0980], which appears as dark orange

[0.9290 0.6940 0.1250]

Sample of RGB triplet [0.9290 0.6940 0.1250], which appears as dark yellow

[0.4940 0.1840 0.5560]

Sample of RGB triplet [0.4940 0.1840 0.5560], which appears as dark purple

[0.4660 0.6740 0.1880]

Sample of RGB triplet [0.4660 0.6740 0.1880], which appears as medium green

[0.3010 0.7450 0.9330]

Sample of RGB triplet [0.3010 0.7450 0.9330], which appears as light blue

[0.6350 0.0780 0.1840]

Sample of RGB triplet [0.6350 0.0780 0.1840], which appears as dark red

clr の既定値は、MATLAB の既定の色を含む RGB 3 成分の行列です。

g の一意のグループすべてに対して十分な色が指定されていない場合、gplotmatrix は clr で指定された値を繰り返して使います。一意のグループの数が既定の色の数 (7) を超える場合に既定値を使用すると、gplotmatrix は必要に応じて既定値を繰り返して使います。

例: 'rgb'

例: [0 0 1; 0 0 0]

データ型: char | string | single | double

マーカーの記号。文字ベクトルまたは string スカラーを指定します。

これらのマーカー オプションから選択できます。

値説明
'o'円
'+'プラス記号
'*'アスタリスク
'.'点
'x'十字
's'正方形
'd'菱形
'^'上向き三角形
'v'下向き三角形
'>'右向き三角形
'<'左向き三角形
'p'星形五角形
'h'星形六角形
'none'マーカーなし

既定では、gplotmatrix は '.' を各グループのマーカーの記号として割り当てます。グループの合計数が指定された記号の数を超えると、gplotmatrix は指定された記号を繰り返して使います。

例: 'x'

例: 'xo+'

データ型: char | string

マーカーのサイズ。正の数値ベクトルを指定します。既定値は、観測値の個数によって決定されます。グループの合計数が指定されたサイズの数を超えると、gplotmatrix は指定されたサイズを繰り返して使います。

例: [6 12]

データ型: single | double

凡例を含めるオプション。'on' または 'off' のいずれかを指定します。既定では、凡例が Figure に表示されます。

プロット行列の対角線上にある図の表示オプション。'stairs'、'hist'、'grpbars'、'none' または 'variable' を指定します。次の表ではさまざまな表示オプションについて説明します。

値説明
'stairs'グループ化されたヒストグラムの輪郭をプロットします。
'hist'ヒストグラムをプロットします。
'grpbars'グループ化されたヒストグラムをプロットします。
'none'空白のプロットを表示します。
'variable'変数名を表示します。この表示オプションを使用するには、xnam を指定しなければなりません。

group に複数のグループが含まれている場合、既定の設定は 'stairs' です。それ以外の場合、gplotmatrix は対角線上の図ごとに 1 つのヒストグラムを表示します。

ヒストグラムを生成するために、gplotmatrix は、数値データには 'pdf' タイプの正規化を使用し、datetime データと duration データには 'count' タイプの正規化を使用します (histogram の名前と値のペアの引数 'Normalization' を参照してください)。y 軸の目盛りのラベルはヒストグラムに適用されないことに注意してください。正しいヒストグラム値を表示するには、データ ヒントを使用します。

X 列の名前。文字配列、string 配列、または文字ベクトルの cell 配列を指定します。xnam には X の各列の名前が 1 つ含まれなければなりません。

例: {'Sepal Length','Sepal Width','Petal Length','Petal Width'}

データ型: char | string | cell

Y 列の名前。文字配列、string 配列、または文字ベクトルの cell 配列を指定します。ynam には Y の各列の名前が 1 つ含まれなければなりません。

例: {'Diastolic','Systolic'}

データ型: char | string | cell

親コンテナー。Figure オブジェクトまたは Panel オブジェクトを指定します。

出力引数

すべて折りたたむ

個々のプロットへの line ハンドル。次の配列のいずれかとして返されます。

  • Y を指定しない場合、Line オブジェクトと Histogram オブジェクトの p x p x k の配列

  • X と Y の両方を指定する場合、Line オブジェクトの q x p x k の配列

p は X の列数、q は Y の列数、k は group の一意なグループ数です。

各散布図には h に k 個の対応する Line オブジェクトがあり、各ヒストグラムには h に k 個の対応する Histogram オブジェクトがあります。

個々のプロットへの Axes ハンドル。Axes オブジェクトの行列として返されます。dispopt が 'hist'、'stairs' または 'grpbars' である場合、ax に 1 つの行が追加され、ヒストグラムをプロットするための非表示の座標軸に対するハンドルが格納されます。

プロット行列全体への Axes ハンドル。Axes オブジェクトとして返されます。bigax は現在の座標軸を指すため、以後の title、xlabel または ylabel コマンドで生成されるラベルはプロット行列全体に対してセンタリングされます。

バージョン履歴

R2006a より前に導入

すべて展開する