nebula

説明

例
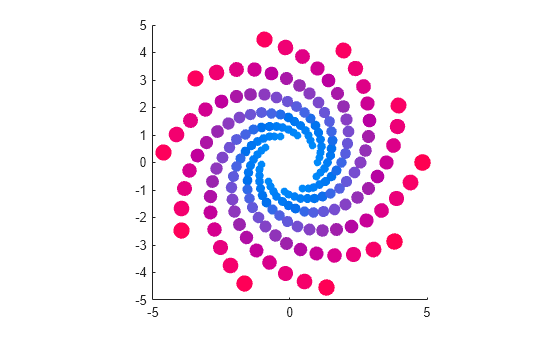
らせんをプロットし、nebula カラーマップを割り当てます。
numLoops = 20;
numPtsPerLoop = 196;
theta = linspace(0,numLoops*2*pi,numPtsPerLoop);
d = exp(0.25*theta/numLoops);
x = d.*cos(theta);
y = d.*sin(theta);
s = scatter(x,y,32*d,d,"filled");
axis square
colormap nebula
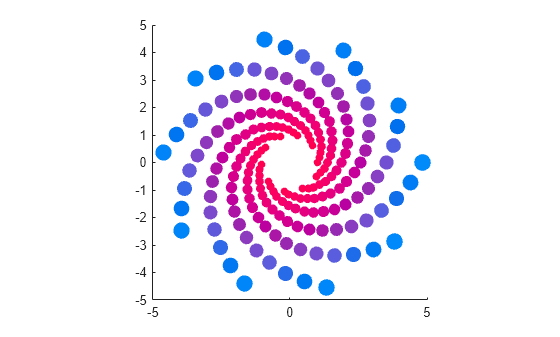
nebula カラーマップ配列を取得し、順序を逆にします。次に、変更したカラーマップをらせんに適用します。
c = nebula;
c = flipud(c);
colormap(c);
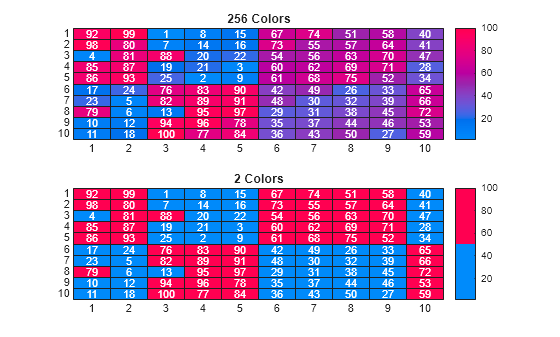
既定では、ヒートマップ チャートは sky カラーマップの 256 色のサンプリングを使用します。関数 heatmap の名前と値の引数 Colormap を指定して、カラーマップとサンプリングを変更できます。
たとえば、2 行 1 列のタイル表示チャート レイアウトで 2 つのヒートマップ チャートを作成します。上のチャートでは nebula カラーマップの 256 色を使用しており、下のチャートでは 2 色のみを使用しています。
tiledlayout(2,1)

% Top chart with default number of colors
nexttile
cdata = magic(10);
heatmap(cdata,Colormap=nebula)
title("256 Colors")

% Bottom chart with two colors
nexttile
heatmap(cdata,Colormap=nebula(2))
title("2 Colors")
入力引数
バージョン履歴
R2025a で導入