colormaplist
説明
cmaps = colormaplist は、使用可能なカラーマップのリストを m 行 1 列の string 配列として返します。
例
カラーマップのリストを返します。
cmaps = colormaplist
cmaps =

  21×1 string array

    "parula"
    "turbo"
    "hsv"
    "hot"
    "cool"
    "spring"
    "summer"
    "autumn"
    "winter"
    "gray"
...特定のカラーマップで定義された RGB 3 成分を返す関数を作成します。
カラーマップのリストを返します。
cmaps = colormaplist
cmaps =

  21×1 string array

    "parula"
    "turbo"
    "hsv"
    "hot"
    "cool"
    "spring"
    "summer"
    "autumn"
    "winter"
    "gray"
    ...
str2func を使用して、turbo カラーマップの最初の n 個の RGB 3 成分を返す関数を定義します。
cmapFcn = str2func(cmaps(2))
cmapFcn =

  function_handle with value:

    @turbo
cmapFcn を使用して、turbo の最初の 5 個の RGB 3 成分をリストします。
cmapFcn(5)
ans =

    0.1900    0.0718    0.2322
    0.1602    0.7332    0.9252
    0.6384    0.9910    0.2365
    0.9853    0.5018    0.1324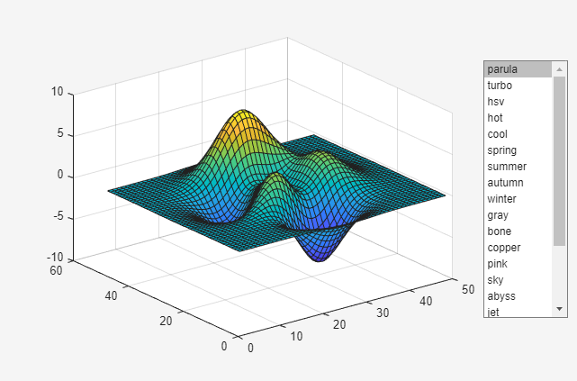
0.4796 0.0158 0.0106plotwithcolormaps 関数を使用して、axes オブジェクトを作成し、座標軸で表面をプロットします。この関数によりリスト ボックスも作成され、colormaplist への呼び出しから得られた結果を使用してリストにデータが入力されます。
function plotwithcolormaps
    f = uifigure;
    ax = axes(f,Units="pixels",Position=[180 100 500 400]);
    cmaps = colormaplist;
    uilistbox(f,Position=[750 200 120 320],Items=cmaps,...
        ValueChangedFcn=@applycmap);
    surf(ax,peaks)

    function applycmap(src,~)
        colormap(src.Parent,src.Value)
    end
end
plotwithcolormaps を保存して実行します。リスト ボックスからオプションを選択して、グラフのカラーマップを変更します。
plotwithcolormaps
バージョン履歴
R2025a で導入