カラーマップを使用したカラー スキームの変更
MATLAB® では、表面プロットなどの可視化表示の際、既定のカラー スキームが使用されます。カラー スキームは、カラーマップを指定して変更できます。カラーマップは、RGB 3 成分を含んだ 3 列の配列で、各行は異なる色を定義します。
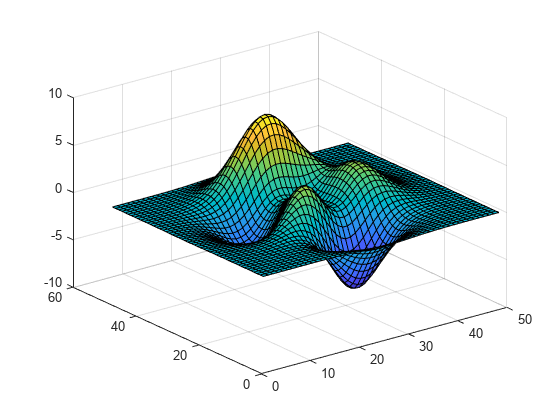
たとえば、次の表面プロットは、既定のカラー スキームを使用しています。
f = figure;
surf(peaks);
次のコマンドによって、現在の Figure のカラーマップが、いくつかの事前定義カラーマップの 1 つであるwinterに変更されます (完全なリストについては色とスタイルを参照)。
colormap winter;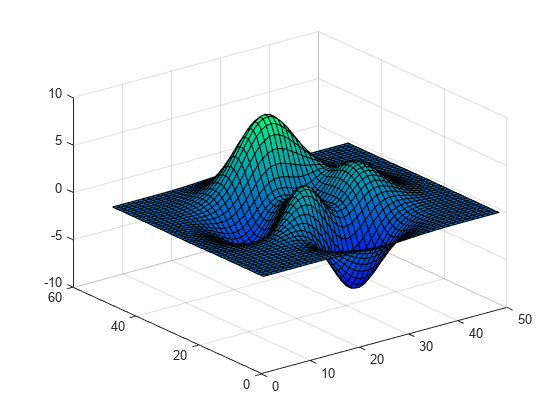
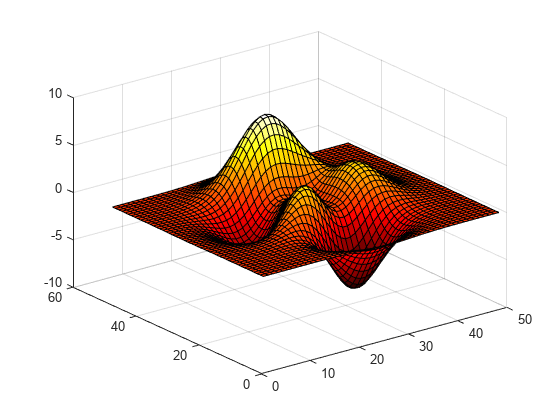
複数の Figure を開いている場合は、関数 colormap の最初の引数として Figure オブジェクトを渡します。
colormap(f,hot);
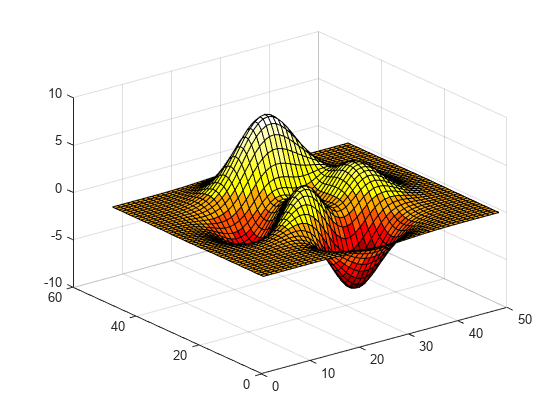
事前定義された各カラーマップには、既定で 256 色のパレットがあります。ただし、事前定義されたカラーマップ関数に 0 または正の整数を渡すことで、任意の数の色を指定できます。たとえば、次のhotカラーマップには 10 のエントリがあります。
c = hot(10);
colormap(c);
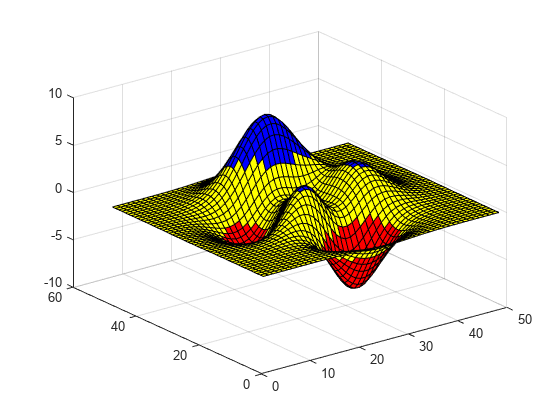
また、m 行 3 列の配列として独自のカラーマップを作成することもできます。配列の各行には、赤、緑、青の強度がそれぞれの色ごとに格納されます。強度値は [0,1] の範囲になります。次の簡単なカラーマップには、3 つのエントリが含まれています。
mycolors = [1 0 0; 1 1 0; 0 0 1];
colormap(mycolors);
複数の座標軸を扱っている場合は、関数 colormap に axes オブジェクトを渡すことで、座標軸ごとに異なるカラーマップを割り当てることができます。
tiledlayout(1,2)
ax1 = nexttile;
surf(peaks);
shading interp;
colormap(ax1,parula(10));

ax2 = nexttile;
surf(peaks);
shading interp;
colormap(ax2,cool(10));
