カスタム プロパティを table および timetable に追加する
この例では、カスタム プロパティの table および timetable への追加、値の設定とアクセス、そして削除の方法を説明します。
すべての table および timetable には、それらに関するメタデータやそれらの変数が含まれるプロパティがあります。これらのプロパティは、T.Properties オブジェクトを通じてアクセスできます。ここで T は table または timetable の名前です。たとえば、T.Properties.VariableNames は、T の変数の名前を含む cell 配列を返します。
T.Properties を通じてアクセスするプロパティは、table や timetable のデータ型の定義の一部です。これらの事前定義されたプロパティは追加または削除できません。ただし、table または timetable の T.Properties.CustomProperties オブジェクトを変更して、独自の "カスタム" プロパティを追加または削除できます。
プロパティの追加
停電データを table に読み取ります。日付と時刻を含む最初の変数 OutageTime を使用してそのデータを並べ替えます。
T = readtable("outages.csv",TextType="string");
T = sortrows(T,"OutageTime")
T=1468×6 table
      Region          OutageTime        Loss     Customers     RestorationTime           Cause
    ___________    ________________    ______    __________    ________________    __________________

    "SouthWest"    2002-02-01 12:18    458.98    1.8202e+06    2002-02-07 16:50    "winter storm"
    "MidWest"      2002-03-05 17:53    96.563    2.8666e+05    2002-03-10 14:41    "wind"
    "MidWest"      2002-03-16 06:18    186.44    2.1275e+05    2002-03-18 23:23    "severe storm"
    "MidWest"      2002-03-26 01:59    388.04    5.6422e+05    2002-03-28 19:55    "winter storm"
    "MidWest"      2002-04-20 16:46     23141           NaN                 NaT    "unknown"
    "SouthWest"    2002-05-08 20:34    50.732         34481    2002-05-08 22:21    "thunder storm"
    "MidWest"      2002-05-18 11:04    1389.1    1.3447e+05    2002-05-21 01:22    "unknown"
    "NorthEast"    2002-05-20 10:57    9116.6    2.4983e+06    2002-05-21 15:22    "unknown"
    "SouthEast"    2002-05-27 09:44    237.28    1.7101e+05    2002-05-27 16:19    "wind"
    "SouthEast"    2002-06-02 16:11         0             0    2002-06-05 05:55    "energy emergency"
    "West"         2002-06-06 19:28    311.86           NaN    2002-06-07 00:51    "equipment fault"
    "SouthEast"    2002-06-17 23:01    42.542         39877    2002-06-17 23:49    "thunder storm"
    "MidWest"      2002-07-01 04:33    203.94         60650    2002-07-02 14:54    "severe storm"
    "MidWest"      2002-07-01 08:18    100.71    1.8116e+05    2002-07-01 11:33    "severe storm"
    "MidWest"      2002-07-10 01:49    168.02           NaN    2002-07-10 17:20    "equipment fault"
    "SouthEast"    2002-07-14 21:32     90.83         60133    2002-07-14 23:53    "thunder storm"
      ⋮
そのプロパティを表示します。これらは、すべての table に共通して含まれているプロパティです。CustomProperties オブジェクトもありますが、既定ではプロパティが含まれていません。
T.Properties
ans =
  TableProperties with properties:

             Description: ''
                UserData: []
          DimensionNames: {'Row'  'Variables'}
           VariableNames: {'Region'  'OutageTime'  'Loss'  'Customers'  'RestorationTime'  'Cause'}
           VariableTypes: ["string"    "datetime"    "double"    "double"    "datetime"    "string"]
    VariableDescriptions: {}
           VariableUnits: {}
      VariableContinuity: []
                RowNames: {}
        CustomProperties: No custom properties are set.
      Use addprop and rmprop to modify CustomProperties.
カスタム プロパティを追加するには、関数 addprop を使用します。プロパティの名前を指定します。また、プロパティごとに、table 全体 (Description プロパティと同様) またはその変数 (VariableNames プロパティと同様) のどちらのメタデータがあるか指定します。プロパティに変数メタデータがある場合、その値は長さが変数の数と同じベクトルにしなければなりません。
出力ファイル名、ファイルのタイプ、およびプロットする変数のインジケーターを含むカスタム プロパティを追加します。ベスト プラクティスとして、入力 table を addprop の出力引数として割り当てて、カスタム プロパティが同じテーブルの一部になるようにすることをお勧めします。出力ファイル名とファイル タイプが table メタデータであることを "table" オプションを使用して指定します。プロット インジケーターが変数メタデータであることを "variable" オプションを使用して指定します。
T = addprop(T,["OutputFileName" "OutputFileType" "ToPlot"], ...
              ["table" "table" "variable"]);
T.Properties
ans =
  TableProperties with properties:

             Description: ''
                UserData: []
          DimensionNames: {'Row'  'Variables'}
           VariableNames: {'Region'  'OutageTime'  'Loss'  'Customers'  'RestorationTime'  'Cause'}
           VariableTypes: ["string"    "datetime"    "double"    "double"    "datetime"    "string"]
    VariableDescriptions: {}
           VariableUnits: {}
      VariableContinuity: []
                RowNames: {}

   Custom Properties (access using t.Properties.CustomProperties.<name>):
          OutputFileName: []
          OutputFileType: []
                  ToPlot: []
カスタム プロパティの値の設定とアクセス
addprop を使用してカスタム プロパティを追加すると、それらの値は既定では空の配列になります。カスタム プロパティの値の設定と値へのアクセスはドット構文を使用して可能です。
出力ファイルの名前とタイプを設定します。これらのプロパティには table のメタデータが含まれています。次に、logical 配列を ToPlot プロパティに割り当てます。このプロパティには、変数のメタデータが含まれます。この例で、ToPlot プロパティの値の要素は、プロットに含む各変数については true、除外する各変数については false です。
T.Properties.CustomProperties.OutputFileName = "outageResults";
T.Properties.CustomProperties.OutputFileType = ".mat";
T.Properties.CustomProperties.ToPlot = [false false true true true false];
T.Properties
ans =
  TableProperties with properties:

             Description: ''
                UserData: []
          DimensionNames: {'Row'  'Variables'}
           VariableNames: {'Region'  'OutageTime'  'Loss'  'Customers'  'RestorationTime'  'Cause'}
           VariableTypes: ["string"    "datetime"    "double"    "double"    "datetime"    "string"]
    VariableDescriptions: {}
           VariableUnits: {}
      VariableContinuity: []
                RowNames: {}

   Custom Properties (access using t.Properties.CustomProperties.<name>):
          OutputFileName: "outageResults"
          OutputFileType: ".mat"
                  ToPlot: [0 0 1 1 1 0]
関数 stackedplot を使用して、積み上げプロットで T からの変数をプロットします。Loss、Customers、および RestorationTime の値のみプロットするには、ToPlot カスタム プロパティを 2 番目の入力引数として使用します。
stackedplot(T,T.Properties.CustomProperties.ToPlot);
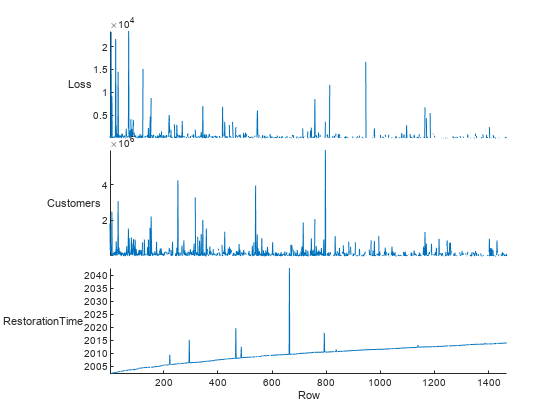
table 変数を移動または削除すると、事前定義されたプロパティとカスタム プロパティの両方が並べ替えられてそれらの値が同じ変数に対応します。この例では、ToPlot カスタム プロパティの値は、VariableNames の事前定義されたプロパティの値が整合するのと同様に、プロット用にマークされた変数と整合します。
Customers 変数を削除し、プロパティを表示します。
T.Customers = [];
T.Properties
ans =
  TableProperties with properties:

             Description: ''
                UserData: []
          DimensionNames: {'Row'  'Variables'}
           VariableNames: {'Region'  'OutageTime'  'Loss'  'RestorationTime'  'Cause'}
           VariableTypes: ["string"    "datetime"    "double"    "datetime"    "string"]
    VariableDescriptions: {}
           VariableUnits: {}
      VariableContinuity: []
                RowNames: {}

   Custom Properties (access using t.Properties.CustomProperties.<name>):
          OutputFileName: "outageResults"
          OutputFileType: ".mat"
                  ToPlot: [0 0 1 1 0]
停電時間を行時間として使用して、table を timetable に変換します。関数 movevars を使用して、Region を table の終わりに移動させ、RestorationTime を最初の変数の前に移動させます。プロパティは適切に並べ替えられています。変数 RestorationTime と変数 Loss には、プロット内に含めることを示すインジケーターもあります。
T = table2timetable(T);
T = movevars(T,"Region",After="Cause");
T = movevars(T,"RestorationTime",Before=1);
T.Properties
ans =
  TimetableProperties with properties:

             Description: ''
                UserData: []
          DimensionNames: {'OutageTime'  'Variables'}
           VariableNames: {'RestorationTime'  'Loss'  'Cause'  'Region'}
           VariableTypes: ["datetime"    "double"    "string"    "string"]
    VariableDescriptions: {}
           VariableUnits: {}
      VariableContinuity: []
                RowTimes: [1468×1 datetime]
               StartTime: 2002-02-01 12:18
              SampleRate: NaN
                TimeStep: NaN
                  Events: []

   Custom Properties (access using t.Properties.CustomProperties.<name>):
          OutputFileName: "outageResults"
          OutputFileType: ".mat"
                  ToPlot: [1 1 0 0]
プロパティの削除
関数 rmprop を使用して table のカスタム プロパティのいずれかまたはすべてを削除できます。ただし、事前定義されたプロパティは table データ型の定義の一部であるため、T.Properties からそれらのプロパティを削除するためには使用できません。
OutputFileName および OutputFileType カスタム プロパティを削除します。残りの table プロパティを表示します。
T = rmprop(T,["OutputFileName" "OutputFileType"]);
T.Properties
ans =
  TimetableProperties with properties:

             Description: ''
                UserData: []
          DimensionNames: {'OutageTime'  'Variables'}
           VariableNames: {'RestorationTime'  'Loss'  'Cause'  'Region'}
           VariableTypes: ["datetime"    "double"    "string"    "string"]
    VariableDescriptions: {}
           VariableUnits: {}
      VariableContinuity: []
                RowTimes: [1468×1 datetime]
               StartTime: 2002-02-01 12:18
              SampleRate: NaN
                TimeStep: NaN
                  Events: []

   Custom Properties (access using t.Properties.CustomProperties.<name>):
                  ToPlot: [1 1 0 0]
参考
readtable | table | head | addprop | table2timetable | movevars | rmprop | sortrows | stackedplot