極座標軸、地理座標軸または複数の座標軸をもつチャートの作成
ChartContainer 基底クラスのサブクラスとして作成するチャートの場合、getAxes メソッドが、単一の直交 axes オブジェクトをサポートする方法を提供します。極座標軸、地理座標軸または複数の座標軸をサポートするには、座標軸を TiledChartLayout オブジェクト (チャート オブジェクトに保存されている) の子として作成し、構成しなければなりません。
単一の Polar Axes オブジェクトまたは Geographic Axes オブジェクトの作成
チャートに単一の polar axes オブジェクトまたは geographic axes オブジェクトを含めるには、次を行います。
座標軸を格納するためのプライベート プロパティを定義します。
setupメソッドで以下を行います。
polar axes オブジェクトを含む基本的なクラスの例を以下に示します。
classdef SimplePolar < matlab.graphics.chartcontainer.ChartContainer
    properties(Access = private,Transient,NonCopyable)
        PolarAx matlab.graphics.axis.PolarAxes
    end

    methods(Access = protected)
        function setup(obj)
            % Get the layout and create the axes
            tcl = getLayout(obj);
            obj.PolarAx = polaraxes(tcl);

            % Other setup code
            % ...
        end
        function update(obj)
            % Update the chart
            % ...
        end
    end
end
複数の axes オブジェクトのタイル表示の作成
複数の座標軸をタイル表示するには、次を行います。
axes オブジェクトを格納するプライベート プロパティを定義します。また、axes オブジェクトの配列を格納する 1 つのプロパティを定義することもできます。
setupメソッドで以下を行います。
2 つの直交座標軸を含む基本的なクラスの例を以下に示します。
classdef TwoAxesChart < matlab.graphics.chartcontainer.ChartContainer
    properties(Access = private,Transient,NonCopyable)
        Ax1 matlab.graphics.axis.Axes
        Ax2 matlab.graphics.axis.Axes
    end

    methods(Access = protected)
        function setup(obj)
            % Get the layout and set the grid size
            tcl = getLayout(obj);
            tcl.GridSize = [2 1];

            % Create the axes
            obj.Ax1 = axes(tcl);
            obj.Ax2 = axes(tcl);

            % Move the second axes to the second tile
            obj.Ax2.Layout.Tile = 2;
        end
        function update(obj)
            % Update the chart
            % ...
        end
    end
end
例: 地理座標軸と直交座標軸を含むチャート
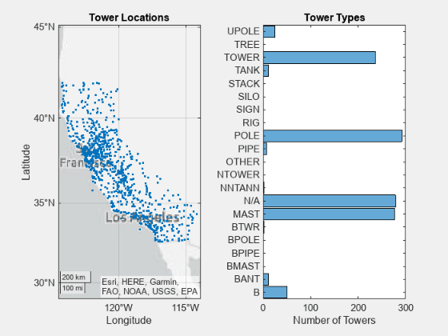
次の例では、2 つの座標軸を使用して、地理データと categorical データを可視化するためのチャートのクラスを定義する方法を示します。左側の座標軸には、複数の携帯電話基地局の場所を示す地図が含まれています。右側の座標軸は、カテゴリ別の基地局の分布を示しています。
次の TowerChart クラスの定義は、以下の方法を示します。
table を格納する
TowerDataというパブリック プロパティを定義する。mustHaveRequiredVariablesというローカル関数を使用して table の内容を検証する。座標軸を格納する
MapAxesおよびHistogramAxesという 2 つのプライベート プロパティを定義する。setupメソッドを実装する。このメソッドはTiledChartLayoutオブジェクトを取得し、レイアウトのグリッド サイズを指定して座標軸を配置します。
クラスを定義するために、次のコードをエディターにコピーし、書き込み可能なフォルダーに TowerChart.m という名前で保存します。
classdef TowerChart < matlab.graphics.chartcontainer.ChartContainer
    properties
        TowerData (:,:) table {mustHaveRequiredVariables} = table([],...
            [],[],'VariableNames',{'STRUCTYPE','Latitude','Longitude'})
    end

    properties (Access = private,Transient,NonCopyable)
        MapAxes matlab.graphics.axis.GeographicAxes
        HistogramAxes matlab.graphics.axis.Axes
        ScatterObject matlab.graphics.chart.primitive.Scatter
        HistogramObject matlab.graphics.chart.primitive.categorical.Histogram
    end

    methods (Access = protected)
        function setup(obj)
            % Configure layout and create axes
            tcl = getLayout(obj);
            tcl.GridSize = [1 2];
            obj.MapAxes = geoaxes(tcl);
            obj.HistogramAxes = axes(tcl);

            % Move histogram axes to second tile
            obj.HistogramAxes.Layout.Tile = 2;

            % Create Scatter and Histogram objects
            obj.ScatterObject = geoscatter(obj.MapAxes,NaN,NaN,'.');
            obj.HistogramObject = histogram(obj.HistogramAxes,categorical.empty,...
                'Orientation','horizontal');

            % Add titles to the axes
            title(obj.MapAxes,"Tower Locations")
            title(obj.HistogramAxes,"Tower Types")
            xlabel(obj.HistogramAxes,"Number of Towers")
        end

        function update(obj)
            % Update Scatter object
            obj.ScatterObject.LatitudeData = obj.TowerData.Latitude;
            obj.ScatterObject.LongitudeData = obj.TowerData.Longitude;

            % Get tower types from STRUCTYPE table variable
            towertypes = obj.TowerData.STRUCTYPE;

            % Check for empty towertypes before updating histogram
            if ~isempty(towertypes)
                obj.HistogramObject.Data = towertypes;
                obj.HistogramObject.Categories = categories(towertypes);
            else
                obj.HistogramObject.Data = categorical.empty;
            end
        end
    end
end

function mustHaveRequiredVariables(tbl)
% Return error if table does not have required variables
assert(all(ismember({'STRUCTYPE','Latitude','Longitude'},...
    tbl.Properties.VariableNames)),...
    'MATLAB:TowerChart:InvalidTable',...
    'Table must have STRUCTYPE, Latitude, and Longitude variables.');
end
クラス ファイルを保存した後、cellularTowers.mat に格納されている table を読み込みます。次に、その table を名前と値のペアの引数として TowerChart コンストラクター メソッドに渡して、チャートのインスタンスを作成します。
load cellularTowers.mat
TowerChart('TowerData',cellularTowers);