cuboidModel
パラメトリック直方体モデルを格納するためのオブジェクト
説明
cuboidModel オブジェクトには、パラメトリック直方体モデルのパラメーターが格納されます。cuboidModel オブジェクトを作成した後、直方体の角の点や直方体の内側の点をオブジェクト関数を使用して抽出できます。直方体モデルは、pcfitcuboid 関数の出力を格納するために使用されます。これは、点群に直方体を当てはめる形状当てはめ関数です。
作成
cuboidModel オブジェクトを作成する方法は 2 つあります。
関数
cuboidModelで直方体のパラメーターを指定して直方体モデルを作成します。pcfitcuboid関数を使用して点群に直方体モデルを当てはめます。
プロパティ
この プロパティ は読み取り専用です。
直方体モデルのパラメーター。[xctr yctr zctr xlen ylen zlen xrot yrot zrot] の形式の 9 要素行ベクトルとして格納されます。
xctr、yctr、zctr は、直方体の中心を指定します。
xlen、ylen、zlen は、回転が適用される前の直方体の x 軸、y 軸、z 軸のそれぞれの方向の長さを指定します。
xrot、yrot、zrot は、直方体の x 軸、y 軸、z 軸のそれぞれの方向の回転角度 (度) を指定します。これらの角度は、対応する軸の順方向を向いて時計回りの方向が正になります。
次の図は、これらの値によって直方体の位置がどのように決まるかを示しています。
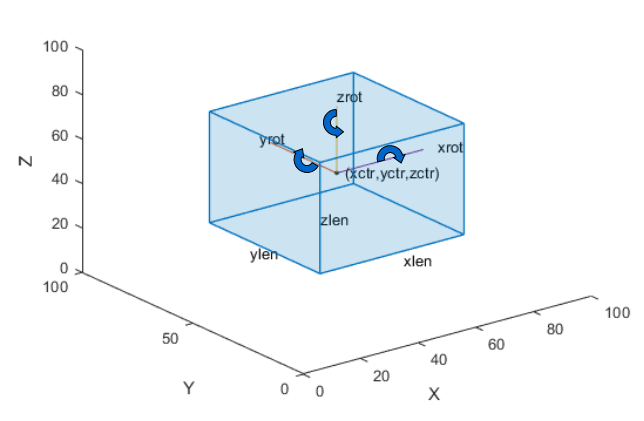
これらのパラメーターは params 入力引数で指定されます。
データ型: single | double
この プロパティ は読み取り専用です。
直方体の中心。[xctr yctr zctr] の形式の 3 要素行ベクトルとして格納されます。このベクトルには、直方体の中心の x 軸、y 軸、z 軸のそれぞれの 3 次元座標が格納されます。
このプロパティは Parameters プロパティから派生します。
データ型: single | double
この プロパティ は読み取り専用です。
直方体の寸法。[xlen ylen zlen] の形式の 3 要素行ベクトルとして格納されます。このベクトルには、直方体の x 軸、y 軸、z 軸のそれぞれの方向の長さが格納されます。
このプロパティは Parameters プロパティから派生します。
データ型: single | double
この プロパティ は読み取り専用です。
直方体の向き (単位は度)。[xrot yrot zrot] の形式の 3 要素行ベクトルとして格納されます。このベクトルには、直方体の x 軸、y 軸、z 軸のそれぞれの方向の角度が格納されます。
このプロパティは Parameters プロパティから派生します。
向きが四元数の場合は、四元数をオイラー角 (度) に変換して直方体モデルを作成します。
データ型: single | double
オブジェクト関数
getCornerPoints | 直方体モデルの角の点を取得 |
findPointsInModel | Find points enclosed by cuboid model |
plot | 直方体モデルのプロット |
例
関数 pcfitcuboid を使用して点群から直方体を検出します。この関数は直方体のパラメーターを cuboidModel オブジェクトとして格納します。
点群データをワークスペースに読み取ります。
ptCloud = pcread('highwayScene.pcd');指定した関心領域 (ROI) 内の点群を検索します。検出された点のみを含む点群を作成します。
roi = [-30 30 -20 30 -8 13];
in = findPointsInROI(ptCloud,roi);
ptCloudIn = select(ptCloud,in);
検出された点の点群をプロットします。
   figure
   pcshow(ptCloudIn.Location)
   xlabel('X(m)')
   ylabel('Y(m)')
   zlabel('Z(m)')
   title('Detected Points in ROI')

点群の指定した ROI に含まれる点のインデックスを調べます。
roi = [9.6 13.8 7.9 9.3 -2.5 3];
sampleIndices = findPointsInROI(ptCloudIn,roi);
点群の指定した点集合に直方体を当てはめます。
 model = pcfitcuboid(ptCloudIn,sampleIndices);
  figure
  pcshow(ptCloudIn.Location)
  xlabel('X(m)')
  ylabel('Y(m)')
  zlabel('Z(m)')
  title('Detect a Cuboid in a Point Cloud')
点群の直方体のボックスをプロットします。
hold on
plot(model)
cuboidModel オブジェクトの内部プロパティを表示します。
model
model =
  cuboidModel with properties:

     Parameters: [11.4873 8.5997 -1.6138 3.6713 1.3220 1.7576 0 0 0.9999]
         Center: [11.4873 8.5997 -1.6138]
     Dimensions: [3.6713 1.3220 1.7576]
    Orientation: [0 0 0.9999]
点群のクラスターの周囲に直方体の境界ボックスを当てはめます。
点群データをワークスペースに読み込みます。
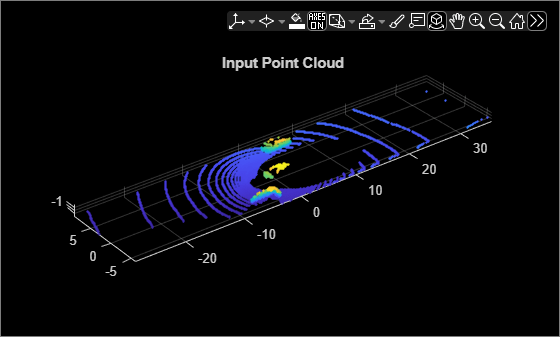
data = load('drivingLidarPoints.mat');関心領域 (ROI) を定義して点群からトリミングします。点群の選択した ROI を可視化します。
roi = [-40 40 -6 9 -2 1];
in = findPointsInROI(data.ptCloud,roi);
ptCloudIn = select(data.ptCloud,in);
hcluster = figure;
panel = uipanel('Parent',hcluster,'BackgroundColor',[0 0 0]);
ax = axes('Parent',panel,'Color',[0 0 0]);
pcshow(ptCloudIn,'MarkerSize',30,'Parent',ax)
title('Input Point Cloud')
地面をセグメント化します。セグメント化された地面を可視化します。
maxDistance = 0.3;
referenceVector = [0 0 1];
[~,inliers,outliers] = pcfitplane(ptCloudIn,maxDistance,referenceVector);
ptCloudWithoutGround = select(ptCloudIn,outliers,'OutputSize','full');
hSegment = figure;
panel = uipanel('Parent',hSegment,'BackgroundColor',[0 0 0]);
ax = axes('Parent',panel,'Color',[0 0 0]);
pcshowpair(ptCloudIn,ptCloudWithoutGround,'Parent',ax)
legend('Ground Region','Non-Ground Region','TextColor', [1 1 1])
title('Segmented Ground Plane')

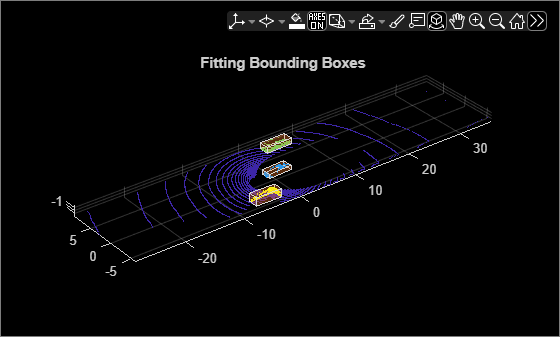
点群の地面以外の領域をクラスターにセグメント化します。セグメント化された点群を可視化します。
distThreshold = 1;
[labels,numClusters] = pcsegdist(ptCloudWithoutGround,distThreshold);
labelColorIndex = labels;
hCuboid = figure;
panel = uipanel('Parent',hCuboid,'BackgroundColor',[0 0 0]);
ax = axes('Parent',panel,'Color',[0 0 0]);
pcshow(ptCloudIn.Location,labelColorIndex,'Parent',ax)
title('Fitting Bounding Boxes')
hold on
各クラスターに境界ボックスを当てはめます。オレンジのハイライトで可視化されます。
for i = 1:numClusters
    idx = find(labels == i);
    model = pcfitcuboid(ptCloudWithoutGround,idx);
    plot(model)
end
拡張機能
バージョン履歴
R2020b で導入