obliqueslice
3 次元ボリューム データからの斜体スライスの抽出
構文
説明
例
3 次元ボリューム データ セットをワークスペースに読み込みます。
load mri関数 squeeze を使用して、大きさが 1 の次元を削除します。
V = squeeze(D);
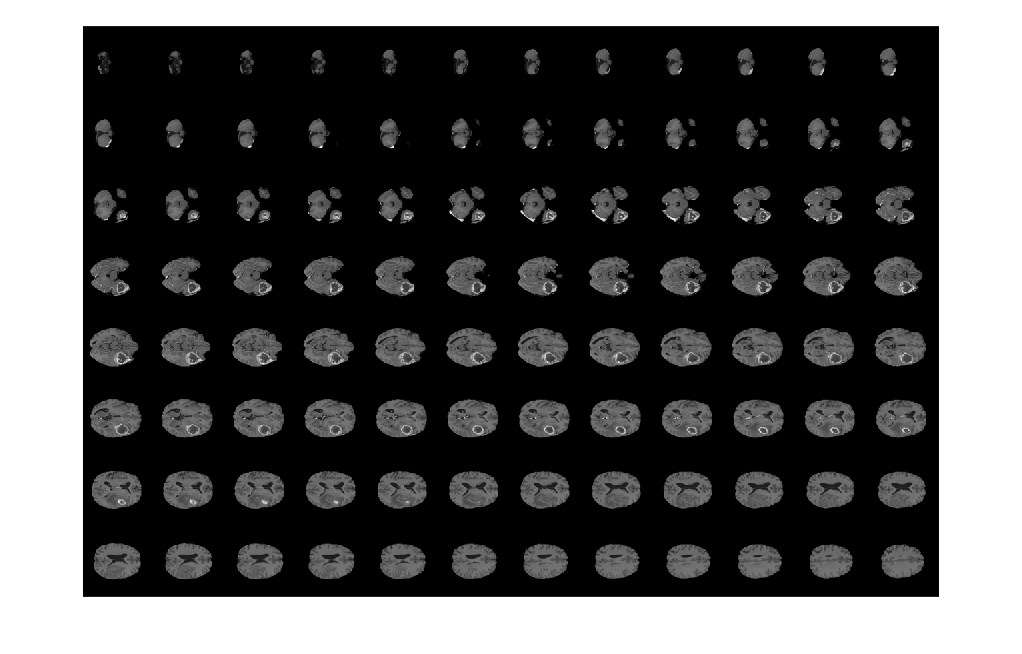
関数 montage を使用して、データの水平スライスを表示します。
montage(V,map,'Size',[3 9]);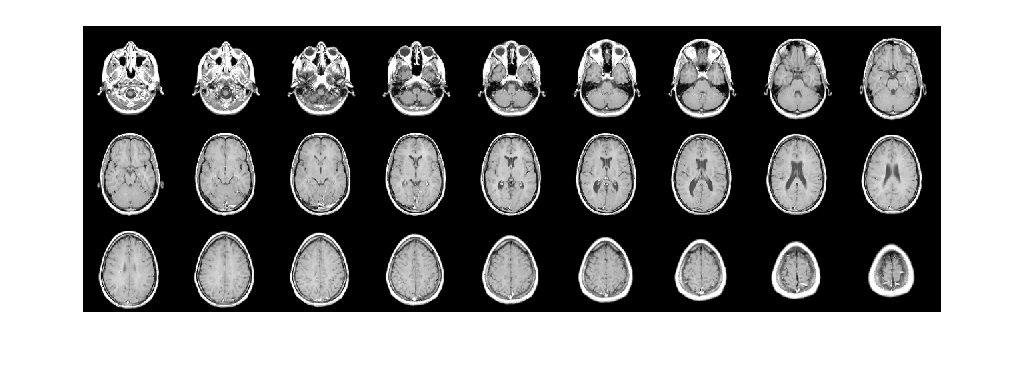
スライスが通過するボリューム内の点を指定します。
point = [73 50 15.5];
3 次元座標空間における法線ベクトルを指定します。
normal = [0 15 20];
ボリューム データからスライスを抽出します。スライスは法線ベクトルに対して垂直であり、指定された点を通過しています。
[B,x,y,z] = obliqueslice(V,point,normal);
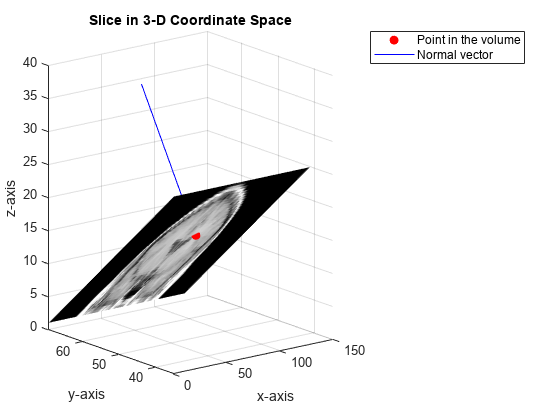
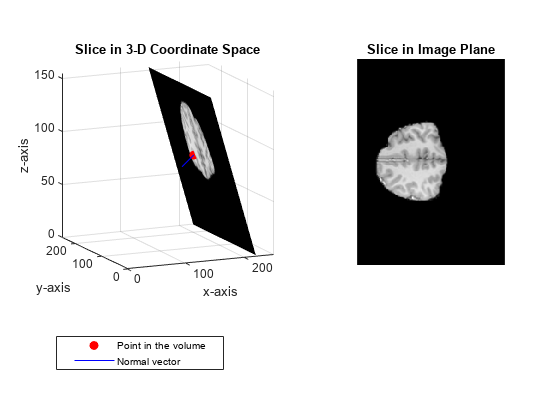
抽出されたスライスを 3 次元座標空間に表示します。
figure
surf(x,y,z,B,'EdgeColor','None','HandleVisibility','off');
grid on
view([-38 12])
colormap(gray)
xlabel('x-axis')
ylabel('y-axis');
zlabel('z-axis');
title('Slice in 3-D Coordinate Space')
点と法線ベクトルをプロットします。
hold on
plot3(point(1),point(2),point(3),'or','MarkerFaceColor','r');
plot3(point(1)+[0 normal(1)],point(2)+[0 normal(2)],point(3)+[0 normal(3)], ...
    '-b','MarkerFaceColor','b');
hold off
legend('Point in the volume','Normal vector')
抽出されたスライスをイメージ平面に表示します。
figure
imshow(B,[])
title('Slice in Image Plane')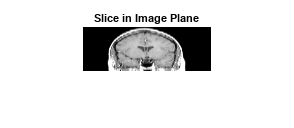
3 次元ボリューム データ セットをワークスペースに読み込みます。
s = load(fullfile(toolboxdir('images'),'imdata','BrainMRILabeled','images','vol_001.mat'));
V = s.vol;
関数 montage を使用して、データの水平スライスを表示します。
montage(V,'Indices',12:118,'Size',[8 12],'DisplayRange',[]);
3 次元座標空間における平面に法線ベクトルを指定します。
normal = [20 0 10];
for ループを使用して、法線ベクトルの方向に沿って複数のスライスを抽出します。それぞれの反復で次を行います。
スライスが通過する点を指定します。
出力サイズを
'Full'に設定し、パディングするピクセルの塗りつぶしの値を 255 に設定して、スライスを抽出します。抽出されたスライスは法線ベクトルに対して垂直であり、指定された点を通過しています。抽出されたスライスを表示します。
sliceIdx = 10:5:180;

figure
for s = 1:length(sliceIdx)

    pt = [sliceIdx(s) 150 80];
    [B,x,y,z] = obliqueslice(V,pt,normal,'OutputSize','Full','FillValues',255);

    Bslices(:,:,s) = B;

    % Display the slice in 3-D coordinate space
    subplot('Position',[0.11 0.36 0.38 0.5])
    surf(x,y,z,B,'EdgeColor','None','HandleVisibility','off');
    grid on
    view([-24 12])
    colormap(gray)
    xlabel('x-axis')
    ylabel('y-axis');
    zlabel('z-axis');
    zlim([0 155]);
    ylim([0 250]);
    xlim([0 250]);
    title('Slice in 3-D Coordinate Space')
    % Plot the point and the normal vector.
    hold on
    plot3(pt(1),pt(2),pt(3),'or','MarkerFaceColor','r')
    plot3( ...
        pt(1)+[-normal(1) normal(1)], ...
        pt(2)+[-normal(2) normal(2)], ...
        pt(3)+[-normal(3) normal(3)], ...
        '-b','MarkerFaceColor','b')
    legend('Point in the volume','Normal vector','Position',[0.1 0.12 0.3 0.08])
    hold off
    % Display the extracted slice.
    subplot('Position',[0.6 0.37 0.34 0.49])
    imshow(B,[])
    title('Slice in Image Plane')
    pause(0.5);
end

関数 montage を使用して、抽出されたイメージ スライスを表示します。
figure
montage(Bslices,'Size',[5 7],'DisplayRange',[]);
入力引数
名前と値の引数
出力引数
詳細
指定された点 (px, py, pz) と法線ベクトル (a, b, c) に従い、obliqueslice 関数は平面の方程式 a(x-px)+b(y-py)+c(z-pz) = 0 を解きます。
点 (px, py, pz) はボリューム データ内にあります。スライス平面は法線ベクトルに対して垂直であり、指定された点を通過しています。
抽出されたスライスの 3 次元空間における座標がどのような順序で 2 次元平面にマッピングされるかは、水平面と垂直面に対する傾斜角に依存します。
obliqueslice 関数は、イメージ スライスを構成する点の 3 次元座標空間における x、y、および z 座標を含む出力行列 x、y、および z を返します。obliqueslice 関数は、これらの点における強度値を内挿し、その値を 2 次元平面にマッピングします。出力行列の最初の値 x(1,1), y(1,1), z(1,1) は、イメージ平面の左上隅のピクセル (1, 1) としてマッピングされる点の 3 次元座標を指定します。イメージ スライスを構成する 3 次元座標およびそれらに関連付けられた強度値は、この点を起点として、左から右、上から下のスキャン順序で読み取られます。これらの強度値は、左から右、上から下の同じスキャン順序で 2 次元イメージ平面を埋めます。
V を入力ボリューム データ、B を 2 次元出力イメージとすると、B(i,j) = V(a,b,c) となります。
ここで、a = x(i,j)、b = y(i,j)、および c = z(i,j) です。