images.compatibility.volshow.R2022a.volshow
The volshow object and the
images.compatibility.volshow.R2022a.volshow function have been removed.
Use the viewer3d and
volshow functions
instead. For more information, see Version History.
Description
A volshow object created by the
images.compatibility.volshow.R2022a.volshow function displays a volume
and enables you to modify the appearance of the display.
Creation
Syntax
Description
images.compatibility.volshow.R2022a.volshow(
displays 3-D grayscale volume V)V in a figure. You can rotate and zoom
in and out on the display interactively using the mouse.
images.compatibility.volshow.R2022a.volshow(
displays the 3-D grayscale volume V,config)V. config is a
struct exported from the Volume Viewer app. The
config struct controls visualization of the volume, containing
values for volshow object properties.
images.compatibility.volshow.R2022a.volshow(
displays the volume, using one or more name-value arguments to set properties that control
the visualization of the volume. For a list of name-value arguments, see Properties.V,Name,Value)
Example: images.compatibility.volshow.R2022a.volshow(V,BackgroundColor="w")
displays 3-D grayscale volume V in a figure with a white background
color.
vs = images.compatibility.volshow.R2022a.volshow(___)volshow object with properties that can be used to control
visualization of the volume.
Input Arguments
Properties
Transparency map for the volume content, specified as a 256-by-1 numeric array, with
values in the range [0, 1]. The default transparency map is the vector
linspace(0,1,256)'.
Background color, specified as an RGB triplet, a color name, or a short color name.
You can specify any color using an RGB triplet. An RGB triplet is a 3-element row vector whose elements specify the intensities of the red, green, and blue components of the color. The intensities must be in the range [0, 1].
You can specify some common colors by name as a string scalar or character vector. This table lists the named color options and the equivalent RGB triplets.
| Color Name | Short Name | RGB Triplet | Appearance |
|---|---|---|---|
"red" | "r" | [1 0 0] |
|
"green" | "g" | [0 1 0] |
|
"blue" | "b" | [0 0 1] |
|
"cyan"
| "c" | [0 1 1] |
|
"magenta" | "m" | [1 0 1] |
|
"yellow" | "y" | [1 1 0] |
|
"black" | "k" | [0 0 0] |
|
"white" | "w" | [1 1 1] |
|
This table lists the default color palettes for plots in the light and dark themes.
| Palette | Palette Colors |
|---|---|
Before R2025a: Most plots use these colors by default. |
|
|
|
You can get the RGB triplets for these palettes using
the orderedcolors function (since R2023b). For example, get the RGB triplets for
the "gem"
palette.
RGB = orderedcolors("gem");Example: "BackgroundColor","r"
Example: "BackgroundColor","green"
Example: "BackgroundColor",[0 0.4470 0.7410]
Location of camera, or the viewpoint, specified as a 3-element vector of the form
[x
              y z]
. This vector defines the axes coordinates of the camera
location, which is the point from which you view the axes. The camera is oriented along
the view axis, which is a straight line that connects the camera position and the camera
target. Changing the CameraPosition property changes the point from
which you view the volume. For an illustration, see Camera Graphics Terminology. Interactively rotating the volume modifies the
value of this property.
Point used as camera target, specified as a 3-element vector of the form [x
y z]. The camera is oriented along the view axis, which is a straight line
that connects the camera position and the camera target. For an illustration, see Camera Graphics Terminology.
Vector defining upwards direction, specified as a 3-element direction vector of the
form [x y z]. By default, volshow defines the
z-axis as the up direction ([0 0 1]). For an
illustration, see Camera Graphics Terminology.
Interactively rotating the volume modifies the value of this property.
Field of view, specified as a scalar angle in the range [0, 180). The larger the angle, the larger the field of view. Also, as the angle increases, objects appear smaller in the scene. For an illustration, see Camera Graphics Terminology.
Colormap of the volume content, specified as a 256-by-3 numeric array with values in the range [0, 1].
Interactivity of the volume, specified as true or
false. When true, you can zoom using the mouse
scroll wheel, and rotate by clicking and dragging on the volume. Rotation and zoom are
performed about the value specified by the CameraTarget property.
When false, you cannot interact with the volume.
Isosurface color, specified as an RGB triplet, a color name, or a short color name.
This property specifies the volume color when the Renderer property
is set to "Isosurface".
You can specify any color using an RGB triplet. An RGB triplet is a 3-element row vector whose elements specify the intensities of the red, green, and blue components of the color. The intensities must be in the range [0, 1].
You can specify some common colors by name as a string scalar or character vector. This table lists the named color options and the equivalent RGB triplets.
| Color Name | Short Name | RGB Triplet | Appearance |
|---|---|---|---|
"red" | "r" | [1 0 0] |
|
"green" | "g" | [0 1 0] |
|
"blue" | "b" | [0 0 1] |
|
"cyan"
| "c" | [0 1 1] |
|
"magenta" | "m" | [1 0 1] |
|
"yellow" | "y" | [1 1 0] |
|
"black" | "k" | [0 0 0] |
|
"white" | "w" | [1 1 1] |
|
This table lists the default color palettes for plots in the light and dark themes.
| Palette | Palette Colors |
|---|---|
Before R2025a: Most plots use these colors by default. |
|
|
|
You can get the RGB triplets for these palettes using
the orderedcolors function (since R2023b). For example, get the RGB triplets for
the "gem"
palette.
RGB = orderedcolors("gem");Example: "IsosurfaceColor","r"
Example: "IsosurfaceColor","green"
Example: "IsosurfaceColor",[0 0.4470 0.7410]
Value that defines the volume surface drawn when the Renderer
property is set to "Isosurface", specified as a nonnegative number in
the range [0, 1].
Include light source in rendering, specified as a logical scalar.
Parent of the volshow object, specified as a
uipanel object or figure object. If you do not
specify a parent, then the parent of the volshow object is
gcf.
Rendering style, specified as one of the values in this table. When the volume is
logical, the default rendering style is
"Isosurface", otherwise the default rendering style is
"VolumeRendering".
| Value | Description |
|---|---|
"VolumeRendering" | View the volume based on the specified color and transparency for each voxel. |
"MaximumIntensityProjection" | View the voxel with the highest intensity value for each ray projected through the data. |
"Isosurface" | View an isosurface of the volume specified by the value in
Isovalue. |
Scale factors used to rescale volume, specified as a 1-by-3 positive numeric array. The values in the array correspond to the scale factor applied in the x, y, and z direction.
Object Functions
setVolume | (Removed) Set new volume in volshow object |
Examples
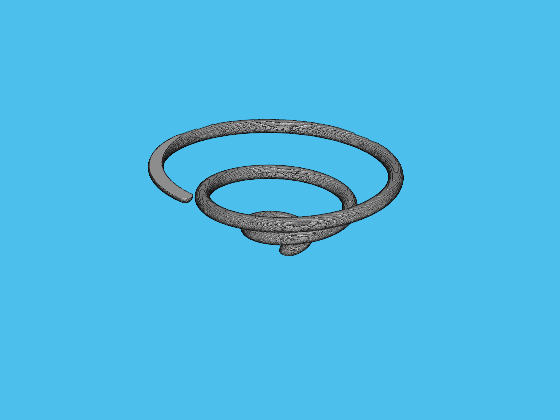
Load and view a volume.
load spiralVol;
v = images.compatibility.volshow.R2022a.volshow(spiralVol);
Tips
The
images.compatibility.volshow.R2022a.volshowfunction creates auipanelobject in the specified parent figure. Panels are containers that group UI components together.volshowdisplays volumetric data in theuipanel. In contrast,imshowdisplays images in anAxes. If you callimshowto display an image in a figure in whichvolshowhas displayed a volume, thenimshowdoes not overwrite the volume displayed byvolshow. TheAxescreated byimshowdisplays behind theuipanel.
Version History
Introduced in R2022bSee Also
Volume
Viewer | volshow | isosurface | slice | obliqueslice