passiveplot
R2026bPlot passivity index as function of frequency
Syntax
Description
The passiveplot function plots the passivity indices of a
dynamic system
model. To customize the plot, you can return a PassivePlot
object and modify it using dot notation. For more information, see Customize Linear Analysis Plots at Command Line.
To obtain sector indices, use the passive
function.
passiveplot( plots the relative
passivity indices of the dynamic system G)G as a function of
frequency. When I + G is minimum phase, the relative
passivity indices are the singular values of (I - G)(I +
G)^-1. The largest singular value measures the relative excess
(R < 1) or shortage (R > 1) at
each frequency. See getPassiveIndex for more
information about the meaning of the passivity index.
passiveplot automatically chooses the frequency range and
number of points for the plot based on the dynamics of
G.
If G is a model with complex coefficients, then
in:
Log frequency scale, the plot shows two branches, one for positive frequencies and one for negative frequencies. The arrows indicate the direction of increasing frequency values for each branch.
Linear frequency scale, the plot shows a single branch with a symmetric frequency range centered at a frequency value of zero.
passiveplot(___,
plots the input, output, or I/O passivity index, depending on the specified type
value.type)
You can use this syntax with any of the previous input-argument combinations.
passiveplot(___, plots
the passivity index for frequencies specified by w)w. You can
specify a frequency range or a vector of frequencies.
passiveplot(___,
plots the passivity index with the plotting options specified in
plotoptions)plotoptions. Settings you specify in
plotoptions override the plotting preferences for the
current MATLAB® session. This syntax is useful when you want to write a script to
generate multiple plots that look the same regardless of the local
preferences.
passiveplot(___,
plots the passivity index for any combination of type,w,plotoptions)type,
w, and plotoptions in any
order.
You can use this syntax with any of the previous input-argument combinations.
passiveplot(___,
specifies response properties using one or more name-value arguments. For
example, Name=Value)passiveplot(sys,Color="r") sets the plot color to
red. (since R2026b)
When plotting responses for multiple systems, the specified name-value arguments apply to all responses.
The following name-value arguments override values specified in other input arguments.
passiveplot(
plots the passivity indices in the specified parent graphics container, such as
a parent,___)Figure or TiledChartLayout, and sets the
Parent property. Use this syntax when you want to
create a plot in a specified open figure or when creating apps in App
Designer. (since R2026b)
pp = passiveplot(___)
Examples
Plot the relative passivity index as a function of frequency of the system .
G = tf([1 2],[1 1]);
passiveplot(G)
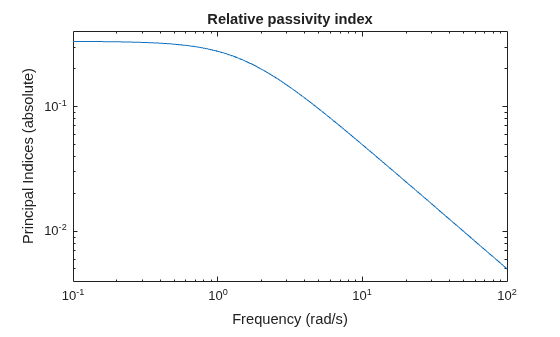
The plot shows that the relative passivity index is less than 1 at all frequencies. Therefore, the system G is passive.
Plot the input passivity index of the same system.
passiveplot(G,"input")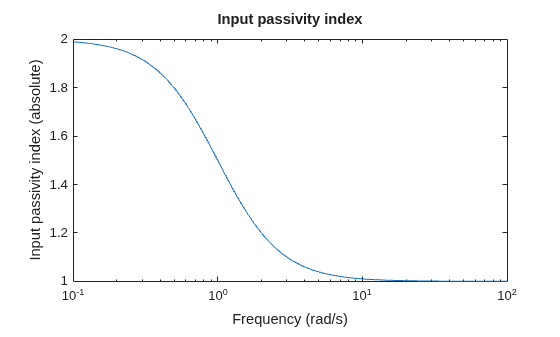
The input passivity index is positive at all frequencies. Therefore, the system is input strictly passive.
Plot the input passivity index of two dynamic systems and their series interconnection.
G1 = tf([5 3 1],[1 2 1]);
G2 = tf([1 1 5 0.1],[1 2 3 4]);
H = G2*G1;

passiveplot(G1,"r",G2,"b--",H,"gx","input")
legend("G1","G2","G2*G1");
The input passivity index of the interconnected system dips below 0 around 1 rad/s. This plot shows that the series interconnection of two passive systems is not necessarily passive. However, passivity is preserved for parallel or feedback interconnections of passive systems.
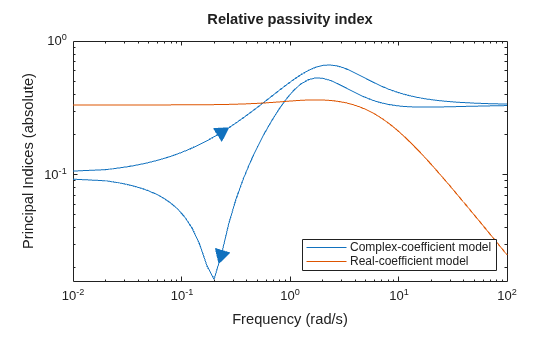
Plot the relative passivity indices of a complex-coefficient model and a real-coefficient model on the same plot.
A = [-3.50,-1.25-0.25i;2,0];
B = [1;0];
C = [-0.75-0.5i,0.625-0.125i];
D = 0.5;
Gc = ss(A,B,C,D);
Gr = tf([1 5 10],[1 10 5]);
passiveplot(Gc,Gr)
legend("Complex-coefficient model","Real-coefficient model", ...
    Location="southeast");
In log frequency scale, the plot shows two branches for models with complex coefficients, one for positive frequencies, with a right-pointing arrow, and one for negative frequencies, with a left-pointing arrow. In both branches, the arrows indicate the direction of increasing frequencies. The plots for models with real coefficients always contain a single branch with no arrows.
Set the plotting frequency scale to linear.
opt = sectorplotoptions;
opt.FreqScale = "Linear";
Plot the indices.
passiveplot(Gc,Gr,opt)
legend("Complex-coefficient model","Real-coefficient model");
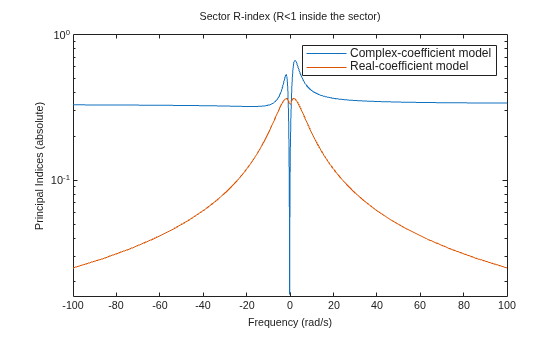
In linear frequency scale, the plots show a single branch with a symmetric frequency range centered at a frequency value of zero. The plot also shows the negative-frequency response of a real-coefficient model when you plot the response along with a complex-coefficient model.
Input Arguments
Name-Value Arguments
Output Arguments
Version History
Introduced in R2016aSee Also
passive | isPassive | getPassiveIndex | getSectorIndex | sectorplot | sectorplotoptions

