残差
目的
残差は、y の外れ値を検出し、回帰モデルの誤差項に関する線形回帰仮定を確認する場合に便利です。てこ比が高い観測では、回帰線または面が当該の観測に移動するため、残差が小さくなります。また、残差を使用して、不等分散性と自己相関の一部を検出することもできます。
定義
Residuals 行列は n 行 4 列のテーブルです。このテーブルには 4 種類の残差が格納されていて、各行が各観測値を表しています。
生の残差
観測値から当てはめ値を引いた値。次の式で表されます。
ピアソン残差
生の残差を平方根平均二乗誤差で除算した値。次の式で表されます。
ここで、ri は生の残差、MSE は平均二乗誤差です。
標準化された残差
標準化された残差は、生の残差を推定標準偏差で除算した値です。観測値 i の標準化された残差は次のようになります。
ここで、MSE は平均二乗誤差、hii は観測値 i のてこ比値です。
スチューデント化残差
スチューデント化残差は、生の残差を残差標準偏差の影響を受けない推定値で除算したものです。観測値 i の残差を、観測値 i を除くすべての観測値に基づいた誤差標準偏差の推定値で除算します。
ここで、MSE(i) は観測値 i を除いて計算した回帰当てはめの平均二乗誤差、hii は観測値 i のてこ比値です。スチューデント化残差 sri は、自由度 n – p – 1 の t 分布に従います。
使用方法
近似モデル (mdl など) を取得した後、fitlm または stepwiselm を使用して、次のことを実行できます。
mdlオブジェクト直下のResidualsテーブルを検出します。ドット表記でプロパティのインデックスを使用し、任意の列をベクトルとして取得します。次に例を示します。
mdl.Residuals.Raw
次の方法を使用して、モデルで近似された値の任意の残差をプロットする。
詳細は、plotResiduals(mdl)
LinearModelクラスのplotResidualsメソッドを参照してください。
残差を使用したモデルの仮定の評価
この例では、近似された線形回帰モデルの残差を調べることにより、モデルの仮定を評価する方法を示します。
標本データを読み込み、独立変数と応答変数をテーブルに格納します。
 load imports-85
 tbl = table(X(:,7),X(:,8),X(:,9),X(:,15),'VariableNames',...
{'curb_weight','engine_size','bore','price'});
線形回帰モデルを当てはめます。
mdl = fitlm(tbl)
mdl =
Linear regression model:
    price ~ 1 + curb_weight + engine_size + bore

Estimated Coefficients:
                    Estimate        SE         tStat       pValue
                   __________    _________    _______    __________

    (Intercept)        64.095        3.703     17.309    2.0481e-41
    curb_weight    -0.0086681    0.0011025    -7.8623      2.42e-13
    engine_size     -0.015806     0.013255    -1.1925       0.23452
    bore              -2.6998       1.3489    -2.0015      0.046711


Number of observations: 201, Error degrees of freedom: 197
Root Mean Squared Error: 3.95
R-squared: 0.674,  Adjusted R-Squared: 0.669
F-statistic vs. constant model: 136, p-value = 1.14e-47
生の残差のヒストグラムをプロットします。
plotResiduals(mdl)
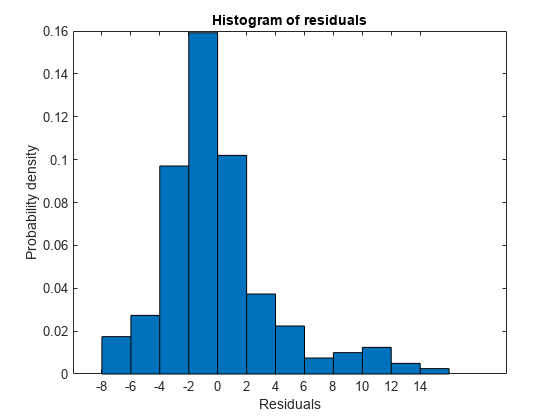
このヒストグラムからは、残差がやや右に歪んでいることがわかります。
4 種類の残差のすべてを箱ひげ図にプロットします。
 Res = table2array(mdl.Residuals);
 boxplot(Res)
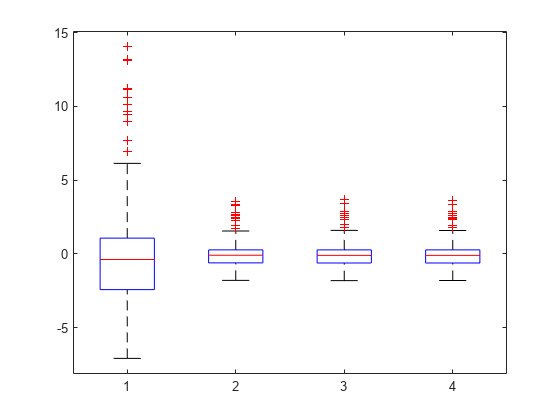
箱ひげ図でも残差の構造が右に歪んでいることがわかります。
生の残差の正規確率プロットをプロットします。
plotResiduals(mdl,'probability')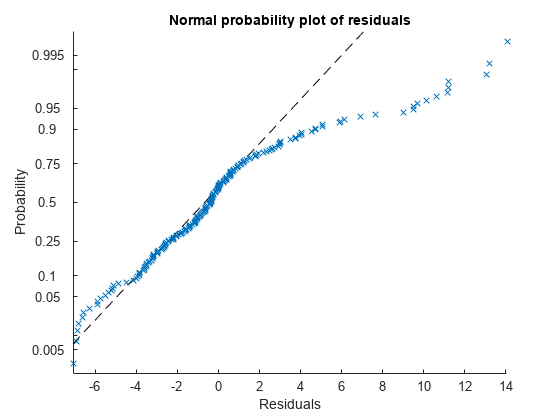
この正規確率プロットでも、正規性からの偏差と、残差の分布の右裾部分の歪みがわかります。
残差とラグ付き残差の対比をプロットします。
plotResiduals(mdl,'lagged')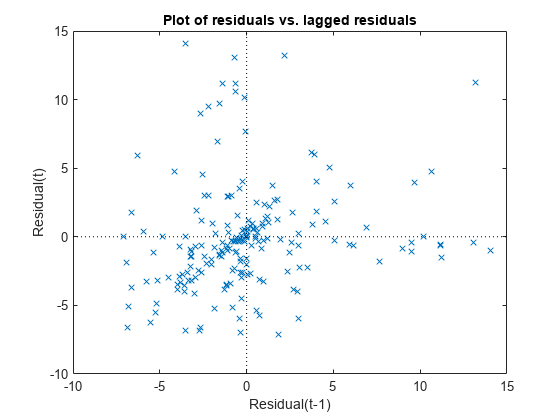
このグラフが示すトレンドから、残差間に相関の可能性があることがわかります。dwtest(mdl) を使用するとその詳細を調べることができます。残差間に系列相関がある場合、一般的にはモデルに改善の余地があるということになります。
残差の対称性プロットをプロットします。
plotResiduals(mdl,'symmetry')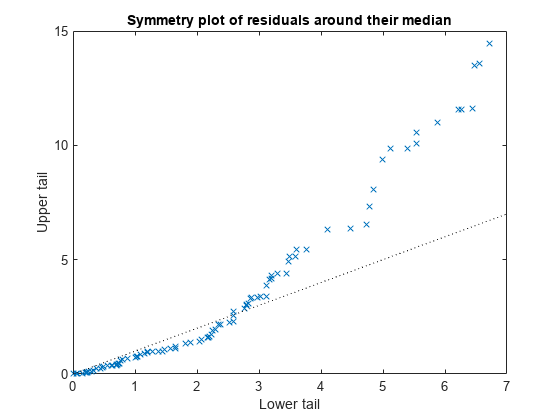
このプロットからは、正規分布で予想される結果と異なり、残差は中央値周辺で均一に分布していないことがわかります。
残差と近似値の対比をプロットします。
plotResiduals(mdl,'fitted')
近似値の増加とともに偏差が増加している場合、不等分散性が発生している可能性があります。
参照
[1] Atkinson, A. T. Plots, Transformations, and Regression. An Introduction to Graphical Methods of Diagnostic Regression Analysis. New York: Oxford Statistical Science Series, Oxford University Press, 1987.
[2] Neter, J., M. H. Kutner, C. J. Nachtsheim, and W. Wasserman. Applied Linear Statistical Models. IRWIN, The McGraw-Hill Companies, Inc., 1996.
[3] Belsley, D. A., E. Kuh, and R. E. Welsch. Regression Diagnostics, Identifying Influential Data and Sources of Collinearity. Wiley Series in Probability and Mathematical Statistics, John Wiley and Sons, Inc., 1980.
参考
LinearModel | fitlm | stepwiselm | plotDiagnostics | plotResiduals | dwtest