View and Trace Callbacks in Models
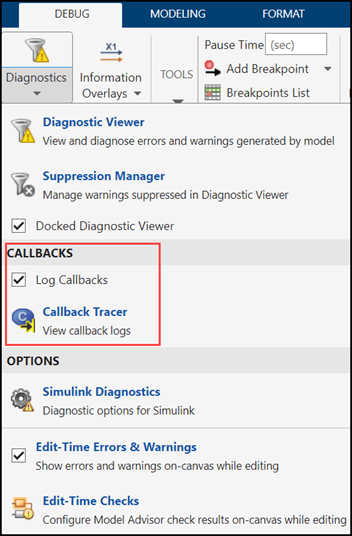
You can view and trace all the callbacks executed in a model. To record all callbacks, on the Simulink® toolstrip, on the Debug tab, under Diagnostics, select Log Callbacks. To view the callback report, go to Debug > Diagnostics > Callback Tracer.
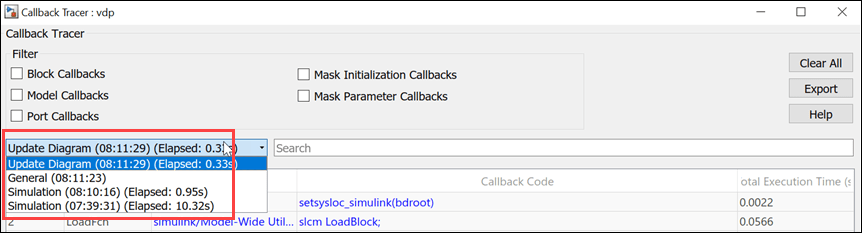
The Callback Tracer report displays the Order, Callback Type, Object Name, Callback Code, and Total Execution Time (s).
This is the callback tracer report for the vdp model.
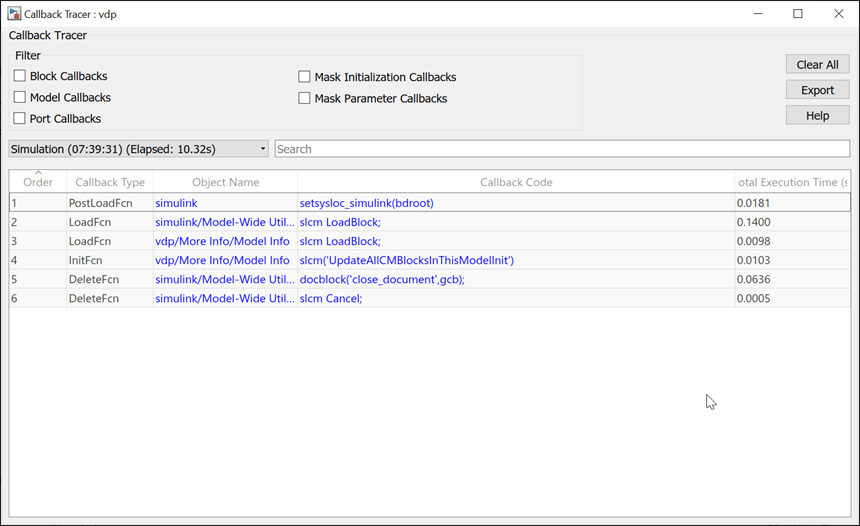
Order: The order in which callbacks are executed. You can sort this column in ascending or descending order.
Callback Type: Callbacks that are executed based on events, for
example, PostLoadFcn, DeleteFcn,
LoadFcn, InitFcn.
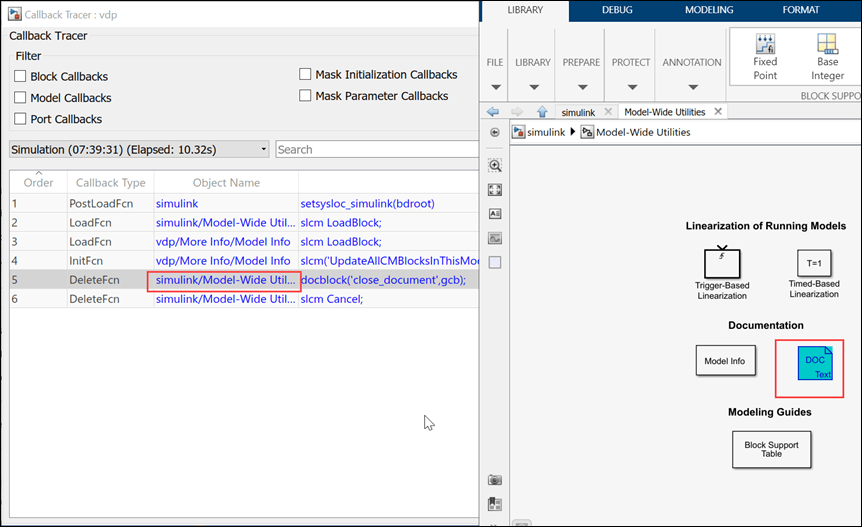
Object Name: The object that triggers the callback. The objects are hyper-linked. Click the hyper-linked object name to navigate to the object. The object is highlighted in the model, which helps you to identify the object without having to search for it.
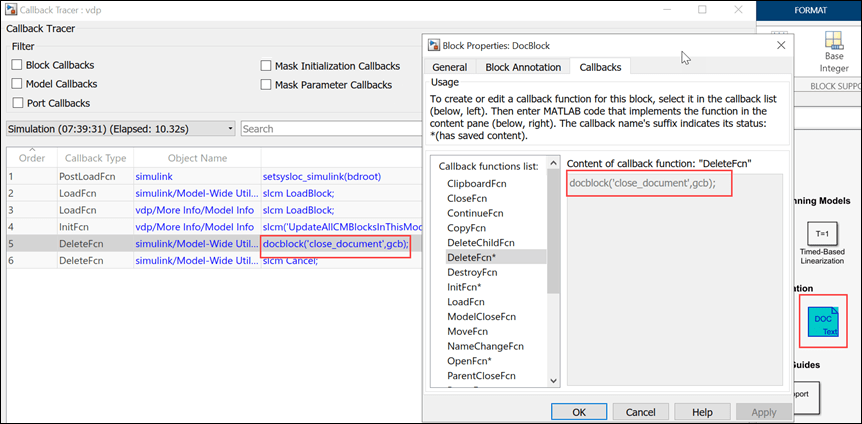
Callback Code: The callback code is displayed in this column. The code is hyper-linked. Click the code to go to the callback code editor, where you can make code changes.
Total Execution Time (s) : The total time to execute the callback code. This column is sortable, which allows you to analyze the performance of the callback code and minimize time.
Filters
You can filter callbacks based on type:
Mask Initialization Callbacks
Stage-Specific Callbacks
The callbacks are recorded for each event, for example, Model
Load, Simulation, Update
Diagram. Click the stage pane and select an event to view callbacks specific
to the event. The time stamp and the time taken for execution are recorded.
Search
Use the Search box to search for specific keywords.
Export
You can export the Callback Tracer report to a TXT or JSON file. To export the Callback Tracer report, click Export, then select the file format.
If you export the report in JSON format, use this code to read the contents of the JSON file.
fileName = 'vdp.json';
str = fileread(fileName);
data = jsondecode(str);
Trace Callbacks Programmatically
To trace callbacks programmatically, enter set_param(0, 'CallbackTracing',
'on') in the MATLAB® Command Window.
The CallbackTracing parameter causes the callbacks to appear in the
MATLAB Command Window as they are invoked. This option applies to all Simulink models, not just models that are open when you enable the preference.