getLabelValues
ラベル付き信号セットからのラベル値の取得
構文
説明
例
クジラの歌の録音を含むラベル付き信号セットを読み込みます。
load whales
lss
lss =
labeledSignalSet with properties:
Source: {2×1 cell}
NumMembers: 2
TimeInformation: "sampleRate"
SampleRate: 4000
Labels: [2×3 table]
Description: "Characterize wave song regions"
Use labelDefinitionsHierarchy to see a list of labels and sublabels.
Use setLabelValue to add data to the set.
ラベルの値を取得します。
lbls = getLabelValues(lss)
lbls=2×3 table
                 WhaleType    MoanRegions    TrillRegions
                 _________    ___________    ____________

    Member{1}      blue       {3×2 table}    {1×3 table}
    Member{2}      blue       {3×2 table}    {1×3 table}
セットの 2 番目の信号の、うめき声の ROI 範囲を表示します。
lbb = getLabelValues(lss,2,'MoanRegions')lbb=3×2 table
ROILimits Value
____________ _____
2.5 3.5 {[1]}
5.8 8 {[1]}
15.4 16.7 {[1]}
信号のふるえ声の領域を ROI 範囲の間にプロットします。ラベル付きのふるえ声のピークを表示します。
tvals = getLabelValues(lss,2,'TrillRegions');
peaks = getLabelValues(lss,2,{'TrillRegions','TrillPeaks'});

sg = getSignal(lss,2);
plot((0:length(sg)-1)/lss.SampleRate,sg)
xlim(tvals.ROILimits)
hold on
plot(peaks.Location,cell2mat(peaks.Value),'v')
hold off
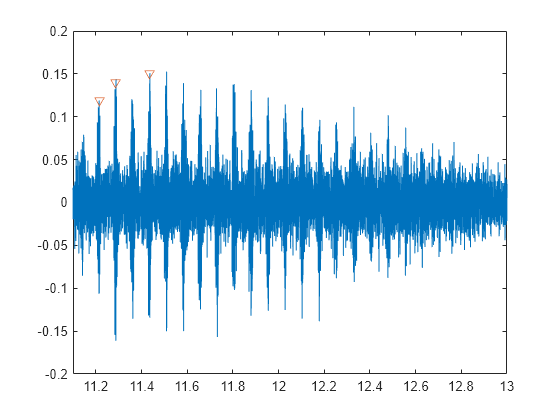
3 番目のふるえ声のピークの座標を表示します。
pcoor = getLabelValues(lss,2,{'TrillRegions','TrillPeaks'}, ...
'LabelRowIndex',1,'SublabelRowIndex',3)pcoor=1×2 table
Location Value
________ __________
11.437 {[0.1500]}