このページは機械翻訳を使用して翻訳されました。最新版の英語を参照するには、ここをクリックします。
シミュレーション上の衛星コンステレーションを使用した GNSS 受信機位置の推定
シミュレートされた全地球航法衛星システム (GNSS ) 受信機を使用してグラウンド ビークルの位置を追跡します。衛星は satelliteScenario オブジェクトを使用してシミュレートされ、受信機の衛星信号処理は lookangles (Navigation Toolbox) および pseudoranges (Navigation Toolbox) 関数を使用してシミュレートされ、受信機の位置は receiverposition (Navigation Toolbox) 関数を使用して推定されます。
概要
この例では、宇宙セグメントまたは衛星コンスタレーション、 、および衛星システムのGNSSセンサー機器に焦点を当てています。GNSS受信機の位置を推定するために、ナビゲーション プロセッサは、空間セグメントからの衛星の位置と、受信機内の測距プロセッサからの疑似距離を必要とします。
シミュレーションパラメーターを指定する
マサチューセッツ州ネイティックにある The MathWorks, Inc. のキャンパスに向かって移動するグラウンド ビークルの実際の位置と速度を含む MAT ファイルをロードします。
シミュレーションの開始、停止、およびサンプル時間を指定します。また、 GNSS受信機のマスク角度、つまり最小仰角指定します。最後に、初期衛星軌道パラメーターのRINEXナビゲーションメッセージファイルを指定します。
% Load ground truth trajectory.
load("routeNatickMA.mat","lat","lon","pos","vel","lla0");
recPos = pos;
recVel = vel;

% Specify simulation times.
startTime = datetime(2021,6,24,8,0,0,"TimeZone","America/New_York");
simulationSteps = size(pos,1);
dt = 1;
stopTime = startTime + seconds((simulationSteps-1)*dt);

% Specify mask angle.
maskAngle = 5; % degrees

% Convert receiver position from north-east-down (NED) to geodetic
% coordinates.
receiverLLA = ned2lla(recPos,lla0,"ellipsoid");

% Specify the RINEX file.
rinexFile = "GODS00USA_R_20211750000_01D_GN.rnx";

% Set RNG seed to allow for repeatable results.
rng("default");
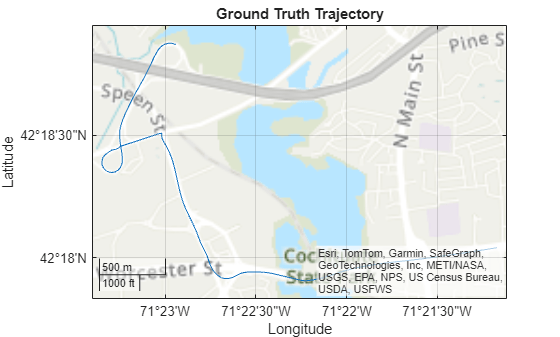
地上の真実の軌跡の geoplot を可視化します。
figure
geoplot(lat,lon)
geobasemap("topographic")
title("Ground Truth Trajectory")
衛星の位置を時間経過とともにシミュレートする
satelliteScenario オブジェクトを使用すると、初期軌道パラメータを指定し、satelliteScenarioViewer オブジェクトを使用して可視化できます。この例では、satelliteScenario と初期軌道パラメーターを含む RINEX ファイルを使用して、時間の経過に伴うGPSコンスタレーションをシミュレートします。あるいは、公称軌道パラメーターまたは RINEX ファイルを使用して衛星の位置をシミュレートする gnssconstellation (Navigation Toolbox) オブジェクトを使用することもできます。この場合、衛星の位置を計算するには、現在のシミュレーション時間のみが必要です。
% Create scenario.
sc = satelliteScenario(startTime, stopTime, dt);

% Initialize satellites.
navmsg = rinexread(rinexFile);
satellite(sc,navmsg);
satID = sc.Satellites.Name;

% Preallocate results.
numSats = numel(sc.Satellites);
allSatPos = zeros(numSats,3,simulationSteps);
allSatVel = zeros(numSats,3,simulationSteps);

% Save satellite states over entire simulation.
for i = 1:numel(sc.Satellites)
    [oneSatPos, oneSatVel] = states(sc.Satellites(i),"CoordinateFrame","ecef");
    allSatPos(i,:,:) = permute(oneSatPos,[3 1 2]);
    allSatVel(i,:,:) = permute(oneSatVel,[3 1 2]);
end
擬似範囲を計算する
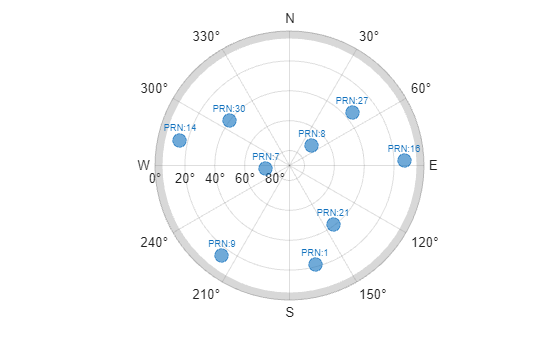
衛星の位置を使用して、シミュレーション全体の疑似距離と衛星の可視性を計算します。マスク角度は、受信機に見える衛星を決定するために使用されます。疑似距離は、衛星とGNSS受信機間の距離です。この距離値は、現在の受信機のクロック時間とタイムスタンプ付き衛星信号間の時間差に光速を掛けて計算されるため、"疑似距離" という用語が使用されます。
% Preallocate results.
allP = zeros(numSats,simulationSteps);
allPDot = zeros(numSats,simulationSteps);
allIsSatVisible = false(numSats,simulationSteps);

% Use the skyplot to visualize satellites in view.
sp = skyplot([],[],MaskElevation=maskAngle);

for idx = 1:simulationSteps
    satPos = allSatPos(:,:,idx);
    satVel = allSatVel(:,:,idx);

    % Calculate satellite visibilities from receiver position.
    [satAz,satEl,allIsSatVisible(:,idx)] = lookangles(receiverLLA(idx,:),satPos,maskAngle);

    % Calculate pseudoranges and pseudorange rates using satellite and
    % receiver positions and velocities.
    [allP(:,idx),allPDot(:,idx)] = pseudoranges(receiverLLA(idx,:),satPos,recVel(idx,:),satVel);

    set(sp,"AzimuthData",satAz(allIsSatVisible(:,idx)), ...
        "ElevationData",satEl(allIsSatVisible(:,idx)), ...
        "LabelData",satID(allIsSatVisible(:,idx)))
    drawnow limitrate
end
疑似距離と衛星の位置から受信機の位置を推定する
最後に、衛星の位置と疑似距離を使用して、receiverposition 関数で受信機の位置を推定します。
% Preallocate results.
lla = zeros(simulationSteps,3);
gnssVel = zeros(simulationSteps,3);
hdop = zeros(simulationSteps,1);
vdop = zeros(simulationSteps,1);

for idx = 1:simulationSteps
    p = allP(:,idx);
    pdot = allPDot(:,idx);
    isSatVisible = allIsSatVisible(:,idx);
    satPos = allSatPos(:,:,idx);
    satVel = allSatVel(:,:,idx);

    % Estimate receiver position and velocity using pseudoranges,
    % pseudorange rates, and satellite positions and velocities.
    [lla(idx,:),gnssVel(idx,:),hdop(idx,:),vdop(idx,:)] = receiverposition(p(isSatVisible),...
        satPos(isSatVisible,:),pdot(isSatVisible),satVel(isSatVisible,:));
end
結果の可視化
地上の真実の位置と推定された受信機の位置を geoplot 上にプロットします。
figure
geoplot(lat,lon,lla(:,1),lla(:,2))
geobasemap("topographic")
legend("Ground Truth","Estimate")

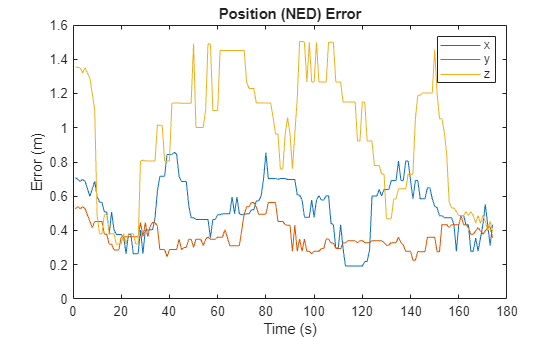
位置推定における絶対誤差をプロットします。誤差は移動中央値によって平滑化され、プロットが読みやすくなります。受信機の両側に衛星があるため、x 軸と y 軸の誤差は小さくなります。受信機の下には衛星がなく、受信機の上にのみ衛星があるため、z 軸の誤差は大きくなります。受信機が移動し、衛星が視界に入ったり消えたりするにつれて、誤差は時間の経過とともに変化します。
estPos = lla2ned(lla,lla0,"ellipsoid");
winSize = floor(size(estPos,1)/10);
figure
plot(smoothdata(abs(estPos-pos),"movmedian",winSize))
legend("x","y","z")
xlabel("Time (s)")
ylabel("Error (m)")
title("Position (NED) Error")
参考
オブジェクト
satelliteScenario|satellite|access|groundStation|satelliteScenarioViewer|conicalSensor|transmitter|receiver