Main Content

tilenum

タイル表示チャート レイアウトのタイルの位置番号

R2022b 以降

    説明

    num = tilenum(t,row,col) は、タイル表示チャート レイアウト t の指定された行と列のタイル番号を返します。rowcol のスカラーを指定するか、行番号と列番号の配列として指定します。

    この構文では、"flow""vertical"、または "horizontal" のタイル配置を使用するレイアウトはサポートしていません。

    num = tilenum(obj) は、タイル表示チャート レイアウトの指定されたオブジェクトのタイル番号を返します。たとえば、この構文を使用して、指定した axes オブジェクトのタイル番号を取得できます。

    この構文では、任意のタイル配置を使用するレイアウトをサポートしています。

    すべて折りたたむ

    4 つのプロットを含む 2 行 2 列のタイル表示チャート レイアウトを作成します。

    t = tiledlayout(2,2);
    
    nexttile
    plot([1 2 3 4])
    
    nexttile
    scatter(1:7,[10 13 5 33 7 12 9])
    
    nexttile
    stairs(1:10)
    
    nexttile
    bar(1:5)

    Figure contains 4 axes objects. Axes object 1 contains an object of type line. Axes object 2 contains an object of type scatter. Axes object 3 contains an object of type stair. Axes object 4 contains an object of type bar.

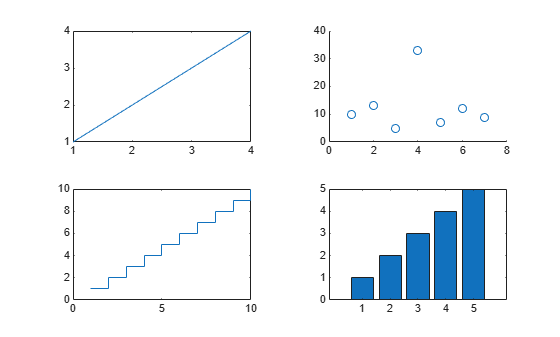
    2 行目の 1 列目にあるタイルの番号を取得します。

    num = tilenum(t,2,1)
    num = 3
    

    すべての行と列のタイル番号を取得します。

    nums = tilenum(t,[1 1 2 2],[1 2 1 2])
    nums = 1×4
    
         1     2     3     4


    4 つのプロットを含む 2 行 2 列のタイル表示チャート レイアウトを作成します。

    t = tiledlayout(2,2);
    
    nexttile
    plot([1 2 3 4])
    
    nexttile
    scatter(1:7,[10 13 5 33 7 12 9])
    
    nexttile
    stairs(1:10)
    
    nexttile
    bar(1:5)

    Figure contains 4 axes objects. Axes object 1 contains an object of type line. Axes object 2 contains an object of type scatter. Axes object 3 contains an object of type stair. Axes object 4 contains an object of type bar.

    TiledChartLayoutChildren プロパティには、レイアウト内のすべての最上位オブジェクトが格納されます。この場合、最上位オブジェクトは座標軸です。Children プロパティのオブジェクトは作成順とは逆の順序になっていることに注意してください。タイル番号を作成順に取得するには、関数 flipud を呼び出して並べ替えられた配列を関数 tilenum に渡します。

    nums = tilenum(flipud(t.Children))
    nums = 4×1
    
         1
         2
         3
         4


    1 行目に 3 つのプロットを含む 3 行 3 列のタイル表示チャート レイアウトを作成します。さらに、残りの空のタイル (2 行 3 列の領域) にまたがる axes オブジェクトを作成します。座標軸の範囲内に棒グラフを作成します。

    tiledlayout(3,3)
    
    nexttile
    plot([1 2 3 4])
    
    nexttile
    plot([4 3 2 1])
    
    nexttile
    stairs(1:10)
    
    % Create spanned axes and bar chart
    spax = nexttile([2 3]);
    bar(spax,1:10)

    Figure contains 4 axes objects. Axes object 1 contains an object of type line. Axes object 2 contains an object of type line. Axes object 3 contains an object of type stair. Axes object 4 contains an object of type bar.

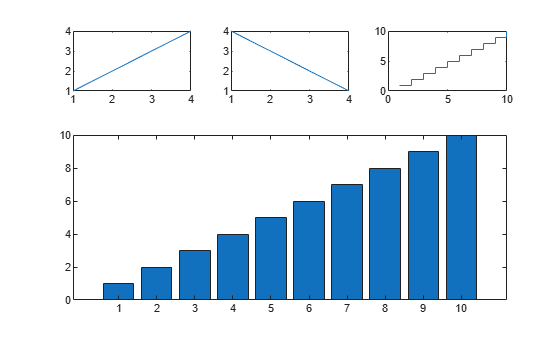
    座標軸の範囲内のタイル番号を取得します。tilenum は、範囲内の一連のタイル全体についてではなく、座標軸の左上隅のタイルの番号を返します。

    num = tilenum(spax)
    num = 4
    

    関数 tilenum を使用して、レイアウトのグリッドの特定の行または列にある座標軸をカスタマイズできます。たとえば、1 行目または 1 列目の座標軸を特定し、それらの座標軸にのみラベルを追加できます。

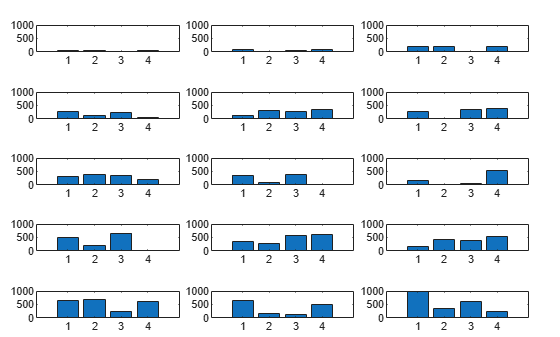
    家庭菜園の 5 か月間の収穫量を表示する 15 個のプロットのグリッドを作成します。4 行 15 列のデータの行列を作成します。行列の各列に特定の月のデータが格納されます。

    scalefactors = (1:15) * 70;
    data = rand(4,15) .* scalefactors;

    左の列と一番上の行のラベルをそれぞれ格納する string ベクトル monthnamescrops を作成します。次に、5 行 3 列のタイル表示チャート レイアウトを作成し、各列のデータを個別のタイルにプロットします。

    monthnames = ["May" "June" "July" "August" "September"];
    crops = ["Asparagus" "Tomatoes" "Lettuce"];
    
    t = tiledlayout(5,3,TileSpacing="compact",Padding="compact");
    for i = 1:length(monthnames)*length(crops)
        nexttile
        bar(data(:,i))
        ylim([0 1000])
    end

    Figure contains 15 axes objects. Axes object 1 contains an object of type bar. Axes object 2 contains an object of type bar. Axes object 3 contains an object of type bar. Axes object 4 contains an object of type bar. Axes object 5 contains an object of type bar. Axes object 6 contains an object of type bar. Axes object 7 contains an object of type bar. Axes object 8 contains an object of type bar. Axes object 9 contains an object of type bar. Axes object 10 contains an object of type bar. Axes object 11 contains an object of type bar. Axes object 12 contains an object of type bar. Axes object 13 contains an object of type bar. Axes object 14 contains an object of type bar. Axes object 15 contains an object of type bar.

    1 列目のプロットの "y" 軸に沿って月の名前を表示します。TiledChartLayout オブジェクトの Children プロパティを使用してレイアウトのすべての座標軸を取得しますが、座標軸は作成順と逆の順序になっています。関数 flipud を呼び出して座標軸を並べ替えます。

    ラベルを追加する各座標軸について、関数 tilenum を呼び出してタイル番号を取得します。そのタイル番号を使用して Children プロパティにインデックスを付け、結果の axes オブジェクトを月の名前と共に関数 ylabel に渡します。

    t.Children = flipud(t.Children);
    for i = 1:length(monthnames)
        num = tilenum(t,i,1);
        ylabel(t.Children(num),monthnames(i))
    end
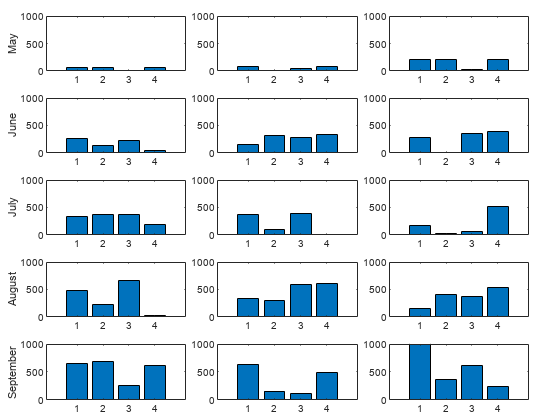
    Figure contains 15 axes objects. Axes object 1 contains an object of type bar. Axes object 2 contains an object of type bar. Axes object 3 with ylabel September contains an object of type bar. Axes object 4 contains an object of type bar. Axes object 5 contains an object of type bar. Axes object 6 with ylabel August contains an object of type bar. Axes object 7 contains an object of type bar. Axes object 8 contains an object of type bar. Axes object 9 with ylabel July contains an object of type bar. Axes object 10 contains an object of type bar. Axes object 11 contains an object of type bar. Axes object 12 with ylabel June contains an object of type bar. Axes object 13 contains an object of type bar. Axes object 14 contains an object of type bar. Axes object 15 with ylabel May contains an object of type bar.

    作物の名前を 1 行目の座標軸のタイトルとして表示します。関数 tilenumChildren プロパティを使用して該当する座標軸を特定し、タイトルを追加します。さらに、全体のタイトルをレイアウトに追加します。

    for i = 1:length(crops)
        num = tilenum(t,1,i);
        title(t.Children(num),crops(i))
    end
    
    title(t,"Johnston Family Farm 2021 Crop Yields")

    Figure contains 15 axes objects. Axes object 1 contains an object of type bar. Axes object 2 contains an object of type bar. Axes object 3 with ylabel September contains an object of type bar. Axes object 4 contains an object of type bar. Axes object 5 contains an object of type bar. Axes object 6 with ylabel August contains an object of type bar. Axes object 7 contains an object of type bar. Axes object 8 contains an object of type bar. Axes object 9 with ylabel July contains an object of type bar. Axes object 10 contains an object of type bar. Axes object 11 contains an object of type bar. Axes object 12 with ylabel June contains an object of type bar. Axes object 13 with title Lettuce contains an object of type bar. Axes object 14 with title Tomatoes contains an object of type bar. Axes object 15 with title Asparagus, ylabel May contains an object of type bar.

    入力引数

    すべて折りたたむ

    位置を特定するタイルを含むタイル表示チャート レイアウト。TiledChartLayout オブジェクトを作成するには、関数 tiledlayout を使用します。

    TiledChartLayout オブジェクトの TileArrangement プロパティは "fixed" に設定されていなければなりません。これは、tiledlayout(m,n) を呼び出して固定数のタイルを作成する場合の既定値です。

    行番号。col と同じサイズの正の整数値のスカラー、ベクトル、または配列として指定します。行番号がレイアウトの行数より大きい場合、その行について tilenumNaN を返します。

    列番号。row と同じサイズの正の整数値のスカラー、ベクトル、または配列として指定します。列番号がレイアウトの列数より大きい場合、その列について tilenumNaN を返します。

    グラフィックス オブジェクト、またはタイル表示チャート レイアウトの子のグラフィックス オブジェクトの配列。指定できるオブジェクトのタイプには以下が含まれます。

    • AxesPolarAxesGeographicAxes オブジェクトなどの座標軸

    • heatmap チャートなどのスタンドアロンの可視化

    • 凡例

    • カラー バー

    • タイル表示チャート レイアウトのタイル内に入れ子にされた TiledChartLayout オブジェクト

    指定されたオブジェクトが "north""south""east"、または "west" のいずれかのタイルのオブジェクトである場合、そのオブジェクトについて tilenumNaN を返します。

    出力引数

    すべて折りたたむ

    タイル番号。タイル番号のスカラー、ベクトル、または配列として返されます。入力をベクトルまたは配列として指定して複数の行と列 (または複数のオブジェクト) をクエリした場合、tilenum は出力を同じサイズのベクトルまたは配列として返します。

    存在しない行または列を指定した場合や obj"north""south""east""west" のいずれかのタイルのグラフィックス オブジェクトである場合、tilenumNaN 値を返します。

    バージョン履歴

    R2022b で導入