Main Content

alphaShape

Polygons and polyhedra from points in 2-D and 3-D

Description

An alphaShape creates a bounding area or volume that envelops a set of 2-D or 3-D points. You can manipulate the alphaShape object to tighten or loosen the fit around the points to create a nonconvex region. You also can add or remove points or suppress holes or regions.

After you create an alphaShape object, you can perform geometric queries. For example, you can determine if a point is inside the shape or you can find the number of regions that make up the shape. You also can calculate useful quantities like area, perimeter, surface area, or volume, and plot the shape for visual inspection.

Creation

To create an alphaShape object, use the alphaShape function with input arguments that define the shape's vertices. You also can specify an alpha radius and hole or region thresholds when you create the alphaShape.

Description

shp = alphaShape(x,y) creates a 2-D alpha shape of the points (x,y) using the default alpha radius. The default alpha radius produces the tightest fitting alpha shape, which encloses all of the points.

shp represents a polygon. The polygon has no isolated points or edges, nor does it have dangling edges.

example

shp = alphaShape(x,y,z) creates a 3-D alpha shape of the points (x,y,z) using the default alpha radius.

shp represents a polyhedron. The polyhedron has the previously stated polygon traits, but it additionally does not have isolated faces or dangling faces.

example

shp = alphaShape(P) specifies points (x,y) or (x,y,z) in the columns of matrix P.

example

shp = alphaShape(___,a) creates an alpha shape with alpha radius a using any of the arguments in the previous syntaxes.

example

shp = alphaShape(___,Name,Value) uses additional options specified by one or more Name,Value pair arguments. For example, you can suppress interior holes or voids using 'HoleThreshold'.

example

Input Arguments

expand all

x-coordinates of points, specified as a column vector.

Data Types: double

y-coordinates of points, specified as a column vector.

Data Types: double

z-coordinates of points, specified as a column vector.

Data Types: double

Point coordinates, specified as a matrix with two columns (for a 2-D alpha shape) or a matrix with three columns (for a 3-D alpha shape).

  • For 2-D, the columns of P represent x and y coordinates, respectively.

  • For 3-D, the columns of P represent x, y, and z coordinates, respectively.

Data Types: double

Alpha radius, specified as a nonnegative scalar. The default alpha radius is a = criticalAlpha(shp,'all-points'), which is the smallest alpha radius that produces an alpha shape that encloses all points.

Specify a = criticalAlpha(shp,'one-region') to use the smallest alpha radius that produces an alpha shape with only one region.

The extreme values of a are

  • Inf, where alphaShape produces the convex hull

  • 0, where alphaShape produces an empty alpha shape

Data Types: double

Name-Value Arguments

Specify optional pairs of arguments as Name1=Value1,...,NameN=ValueN, where Name is the argument name and Value is the corresponding value. Name-value arguments must appear after other arguments, but the order of the pairs does not matter.

Before R2021a, use commas to separate each name and value, and enclose Name in quotes.

Example: shp = alphaShape(...,'HoleThreshold',10)

Maximum area or volume of interior holes or voids to fill in, specified as a finite, nonnegative scalar.

  • For 2-D, HoleThreshold specifies the maximum area of interior holes to fill in.

  • For 3-D, HoleThreshold specifies the maximum volume of interior voids to fill in. Holes extending completely through the alpha shape cannot be filled in.

When you specify both a 'HoleThreshold' and a 'RegionThreshold', the application of the thresholds is order dependent. alphaShape fills in holes before suppressing regions.

Data Types: double

Maximum area (2-D) or volume (3-D) of regions to suppress, specified as a finite, nonnegative scalar.

When you specify a 'HoleThreshold' and a 'RegionThreshold', the application of the thresholds is order dependent. alphaShape fills in holes before suppressing regions.

Data Types: double

Properties

expand all

Coordinates of points, specified as a matrix with two or three columns (for 2-D or 3-D point sets). These points are initially used to create the alpha shape, excluding duplicates.

Data Types: double

Alpha radius, specified as a nonnegative scalar. The alpha radius is the radius of the alpha disk or sphere that sweeps over the points to create the alpha shape.

The default alpha radius is a = criticalAlpha(shp,'all-points'), which is the smallest alpha radius that produces an alpha shape enclosing all points. Specify a = criticalAlpha(shp,'one-region') to use the smallest alpha radius that produces an alpha shape with only one region.

The extreme values of Alpha have the following conditions:

  • If Alpha is Inf, then alphaShape produces the convex hull.

  • If Alpha is 0, then the resulting alphaShape is empty.

Data Types: double

Maximum area or volume of interior holes or voids to fill in, specified as a finite nonnegative scalar.

  • For 2-D, HoleThreshold specifies the maximum area of interior holes to fill in.

  • For 3-D, HoleThreshold specifies the maximum volume of interior voids to fill in. Holes extending completely through the 3-D alpha shape cannot be filled in.

The default value is 0, so that alphaShape does not suppress any holes or voids. The application of the HoleThreshold and RegionThreshold properties is order-dependent. alphaShape fills in holes before suppressing regions.

Data Types: double

Maximum area (2-D) or volume (3-D) of regions to suppress, specified as a finite nonnegative scalar.

The default value is 0, so that alphaShape does not suppress any regions. The application of the HoleThreshold and RegionThreshold properties is order-dependent. alphaShape fills in holes before suppressing regions.

Data Types: double

Object Functions

alphaSpectrumAlpha values giving distinct alpha shapes
criticalAlphaAlpha radius defining critical transition in shape
numRegionsNumber of regions in alpha shape
inShapeDetermine if point is inside alpha shape
alphaTriangulationTriangulation that fills alpha shape
boundaryFacetsBoundary facets of alpha shape
perimeterPerimeter of 2-D alpha shape
areaArea of 2-D alpha shape
surfaceAreaSurface area of 3-D alpha shape
volumeVolume of 3-D alpha shape
plotPlot alpha shape
nearestNeighborDetermine nearest alpha shape boundary point

Examples

collapse all

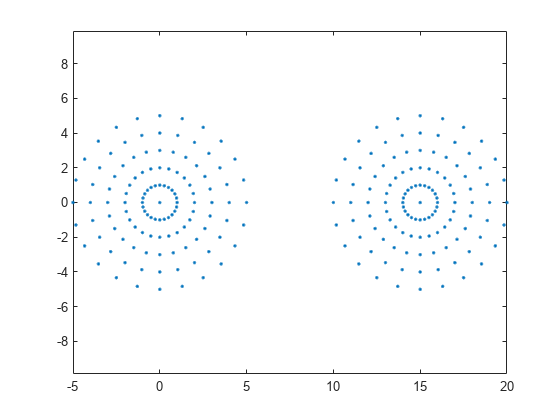
Find the shape of a 2-D point cloud of data.

Create and plot a set of 2-D points.

th = (pi/12:pi/12:2*pi)';
x1 = [reshape(cos(th)*(1:5), numel(cos(th)*(1:5)),1); 0];
y1 = [reshape(sin(th)*(1:5), numel(sin(th)*(1:5)),1); 0];
x = [x1; x1+15];
y = [y1; y1];
plot(x,y,'.')
axis equal

Figure contains an axes object. The axes contains a line object which displays its values using only markers.

Compute an alpha shape for the point set using the default alpha radius.

shp = alphaShape(x,y);
plot(shp)

Figure contains an axes object. The axes object contains an object of type patch.

Check the value of the default alpha radius.

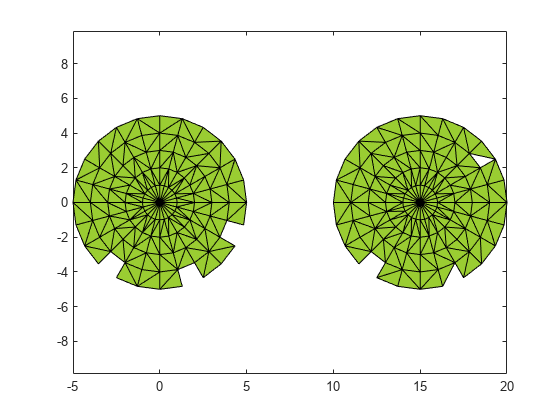
shp.Alpha
ans = 
0.7752

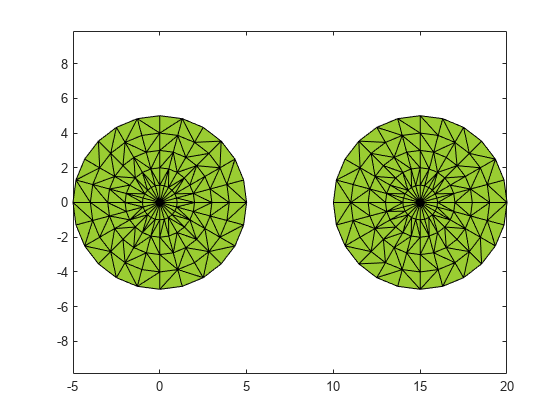
The default alpha radius results in an alpha shape with a jagged boundary. To better capture the boundary of the point set, try a larger alpha radius.

Compute an alpha shape using an alpha value of 2.5.

shp.Alpha = 2.5;
plot(shp)

Figure contains an axes object. The axes object contains an object of type patch.

Find the shape of a 3-D point cloud of data.

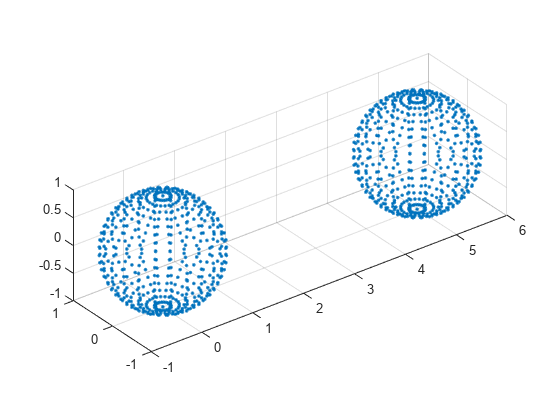
Create and plot a set of 3-D points.

[x1,y1,z1] = sphere(24);
x1 = x1(:);
y1 = y1(:);
z1 = z1(:);
x2 = x1+5;
P = [x1 y1 z1; x2 y1 z1];
P = unique(P,'rows');
plot3(P(:,1),P(:,2),P(:,3),'.')
axis equal
grid on

Figure contains an axes object. The axes contains a line object which displays its values using only markers.

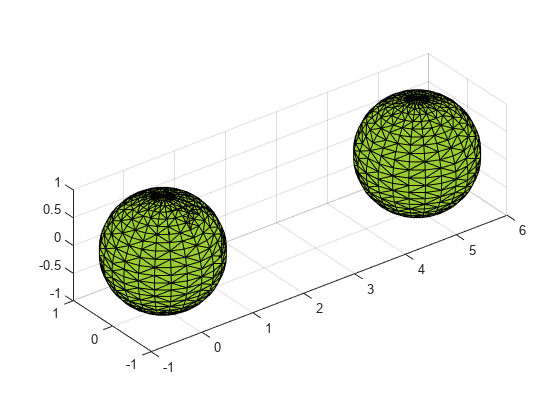
Compute a 3-D alpha shape using an alpha radius of 1.

shp = alphaShape(P(:,1),P(:,2),P(:,3),1);
plot(shp)
axis equal

Figure contains an axes object. The axes object contains an object of type patch.

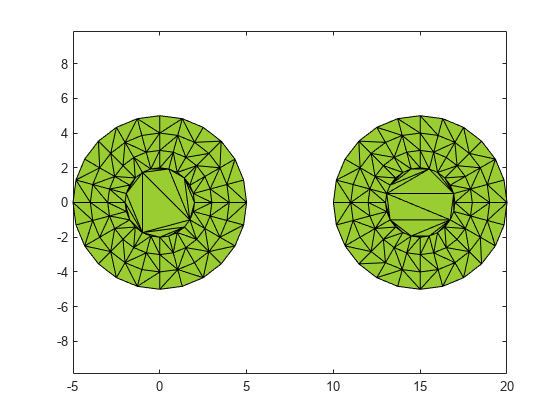
Create an alpha shape by specifying its alpha radius, and fill the holes in an alpha shape.

Create and plot a 2-D set of points.

th = (pi/12:pi/12:2*pi)';
x1 = [reshape(cos(th)*(2:5), numel(cos(th)*(2:5)),1);];
y1 = [reshape(sin(th)*(2:5), numel(sin(th)*(2:5)),1);];
x = [x1; x1+15;];
y = [y1; y1];
plot(x,y,'.')
axis equal

Figure contains an axes object. The axes contains a line object which displays its values using only markers.

Compute an alpha shape for the point set using an alpha radius of 1.

shp = alphaShape(x,y,1);
plot(shp)

Figure contains an axes object. The axes object contains an object of type patch.

An alpha radius of 1 results in an alpha shape with two regions containing holes. To suppress the small holes in the alpha shape, you can specify a HoleThreshold by estimating the area of the largest hole to fill. To fill all holes in the shape, you can assign an arbitrarily large value to HoleThreshold.

Create a new alpha shape that suppresses the holes by specifying a HoleThreshold of 15.

shp = alphaShape(x,y,1,'HoleThreshold',15);
plot(shp)

Figure contains an axes object. The axes object contains an object of type patch.

Control the number of regions of an alpha shape by setting a region threshold.

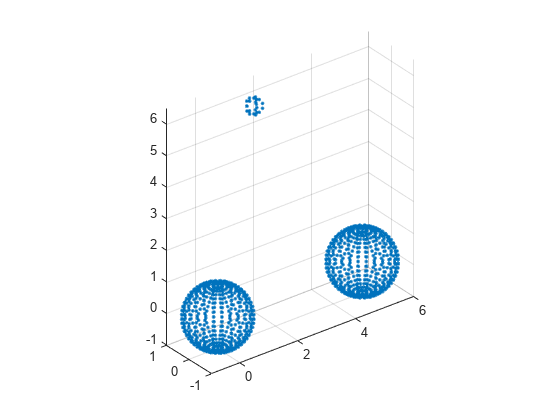
Create and plot a set of 3-D points.

[x1,y1,z1] = sphere(24);
x1 = x1(:);
y1 = y1(:);
z1 = z1(:);
x2 = x1+5;
[x3,y3,z3] = sphere(5);
x3 = x3(:)+5;
y3 = y3(:);
z3 = z3(:)+25;
P = [x1 y1 z1; x2 y1 z1; 0.25*x3 0.25*y3 0.25*z3];
P = unique(P,'rows');
plot3(P(:,1),P(:,2),P(:,3),'.')
axis equal
grid on

Figure contains an axes object. The axes contains a line object which displays its values using only markers.

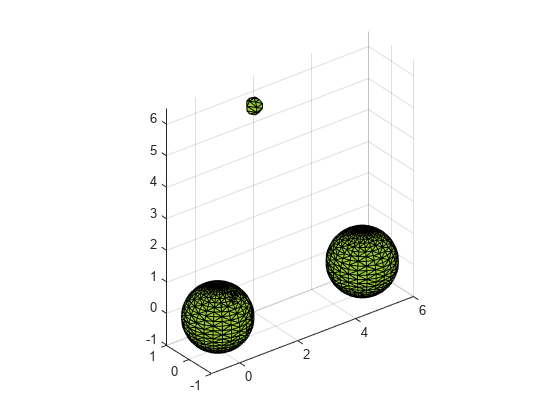
Compute an alpha shape for the point set using an alpha radius of 1.

shp = alphaShape(P,1);
plot(shp)
axis equal

Figure contains an axes object. The axes object contains an object of type patch.

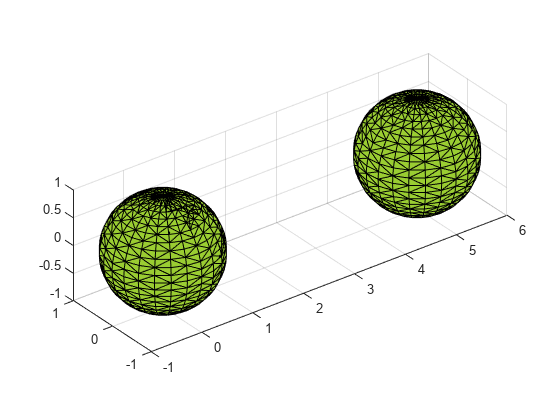
In this case, the alpha shape produces a small region above the two equal-sized spheres. To suppress this region, you can specify a RegionThreshold by estimating its volume.

Specify a RegionThreshold of 2. The resulting shape contains only the two larger regions.

shp.RegionThreshold = 2;
plot(shp)
axis equal

Figure contains an axes object. The axes object contains an object of type patch.

Add points to an existing alpha shape.

Create and plot a 2-D set of points.

th = (pi/12:pi/12:2*pi)';
x1 = [reshape(cos(th)*(1:5), numel(cos(th)*(1:5)),1); 0];
y1 = [reshape(sin(th)*(1:5), numel(sin(th)*(1:5)),1); 0];
x = [x1; x1+15;];
y = [y1; y1];
plot(x,y,'.')
axis equal

Figure contains an axes object. The axes contains a line object which displays its values using only markers.

Compute an alpha shape for the point set using an alpha radius of 1. The resulting alpha shape has two regions.

shp = alphaShape(x,y,1);
plot(shp)

Figure contains an axes object. The axes object contains an object of type patch.

Now add a third region to the alpha shape by adding new points directly to the shp.Points matrix.

x3 = x1+8;
y3 = y1+10;
shp.Points(end+1,:) = [x3 y3];
plot(shp)

Figure contains an axes object. The axes object contains an object of type patch.

Extended Capabilities

Version History

Introduced in R2014b