Latitude and Longitude
Two angles, latitude and longitude, specify the position of a point on the surface of a planet. The most common angular units are degrees and radians. Most Mapping Toolbox™ functions perform angle computations in degrees.
The latitude of a point is the angle between the plane of the equator and a line that connects the point to the rotational axis of the planet. The type and value of the latitude depends on the way you define the line. Latitude is positive in the northern hemisphere, reaching a limit of +90° at the north pole, and negative in the southern hemisphere, reaching a limit of –90° at the south pole. Lines of constant latitude are called parallels.
The longitude of a point is the angle at the center of the planet between two planes that align with and extend from the axis of rotation, perpendicular to the plane of the equator. One plane passes through the point, and the other plane is the prime meridian (0° longitude), which is defined by the location of the Royal Observatory in Greenwich, England. Lines of constant longitude are called meridians. All meridians converge at the north and south poles. As a result, longitude is underspecified at the poles.
Longitudes typically range from –180° to +180°, though you can also use ranges such as
0° to +360°. Adding or subtracting 360° to or from the longitude of a point does not
change the position of the point. To convert longitudes from one range to another, use
the wrapTo180, wrapTo360, wrapToPi, or wrapTo2Pi function.
Plot Latitude and Longitude
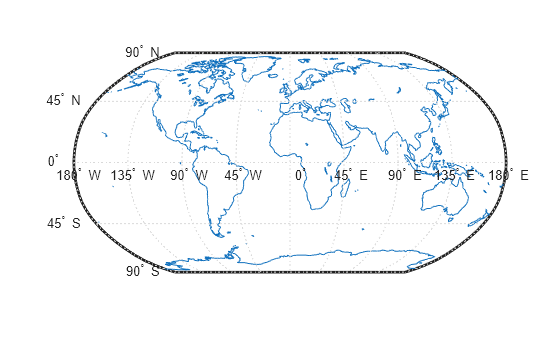
Load a MAT file containing the coordinates of global coastlines. The variables within the MAT file, coastlat and coastlon, specify numeric latitude and longitude coordinates, respectively.
load coastlinesSet up a map of the world by using the worldmap function. The function automatically selects the map projection and the coordinate limits based on the region you specify.
figure
worldmap world
Display the coastline data by using the plotm function.
plotm(coastlat,coastlon)
