このページは機械翻訳を使用して翻訳されました。最新版の英語を参照するには、ここをクリックします。
plotm
axesmベースのマップに 2D のラインと点を投影する
説明
plotm( は、名前と値のペアの引数を使用して、lat,lon,Name,Value)XData、YData、および ZData を除く任意の数の Line のプロパティ を指定します。Name はプロパティ名であり、Value は対応する値です。Name は一重引用符で囲む必要があります (' ')。Name1,Value1,...,NameN,ValueN のように、複数の名前と値のペアの引数を、任意の順番で指定できます。プロパティ名は省略可能であり、大文字と小文字は区別されません。
h = plotm(___)
例
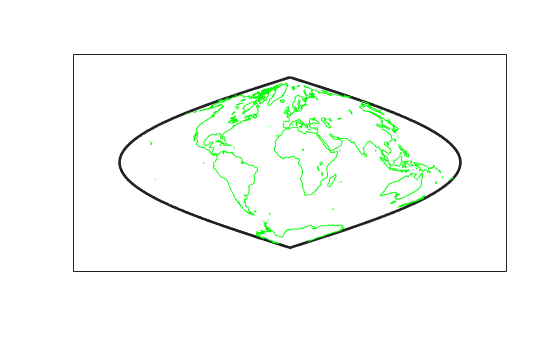
まず、ワークスペースに海岸線データを読み込み、マップを作成します。次に、データをプロットします。plotm 関数は、coastlat と coastlon の NaN 値を使用して、データを個別のラインに分割します。
load coastlines
ax = axesm('sinusoid','Frame','on');
plotm(coastlat,coastlon,'g')
入力引数
数値ベクトルとして指定された緯度または経度ベクトル。axesm ベースのマップの AngleUnits プロパティに一致する単位で値を指定します。lat と lon は同じサイズである必要があります。
NaN 値を使用して、ラインまたはポリゴンにブレークを作成します。たとえば、このコードは最初の 3 つの要素をプロットし、4 番目の要素をスキップし、最後の 3 つの要素を使用して別のラインを描画します。
lat = [0 1 2 NaN 4 5 6];
lon = [0 1 2 NaN 3 4 5];
axesm('UTM','Zone','31N','Frame','on')
plotm(lat,lon)
ライン スタイル、マーカー、および色。記号を含む string スカラーまたは文字ベクトルとして指定します。記号は任意の順序で表記できます。3 つの特性 (ライン スタイル、マーカー、色) をすべて指定する必要はありません。たとえば、ライン スタイルを省略してマーカーを指定する場合、プロットはラインなしでマーカーのみを表示します。
例: "--or" は、円マーカーをもつ赤い破線です。
| ライン スタイル | 説明 | 結果として得られるライン |
|---|---|---|
"-" | 実線 |
|
"--" | 破線 |
|
":" | 点線 |
|
"-." | 一点鎖線 |
|


| マーカー | 説明 | 結果のマーカー |
|---|---|---|
"o" | 円 |
|
"+" | プラス記号 |
|
"*" | アスタリスク |
|
"." | 点 |
|
"x" | 十字 |
|
"_" | 水平線 |
|
"|" | 垂直線 |
|
"square" | 正方形 |
|
"diamond" | 菱形 |
|
"^" | 上向き三角形 |
|
"v" | 下向き三角形 |
|
">" | 右向き三角形 |
|
"<" | 左向き三角形 |
|
"pentagram" | 星形五角形 |
|
"hexagram" | 星形六角形 |
|


| 色名 | 省略名 | RGB 3 成分 | 外観 |
|---|---|---|---|
"red" | "r" | [1 0 0] |
|
"green" | "g" | [0 1 0] |
|
"blue" | "b" | [0 0 1] |
|
"cyan" | "c" | [0 1 1] |
|
"magenta" | "m" | [1 0 1] |
|
"yellow" | "y" | [1 1 0] |
|
"black" | "k" | [0 0 0] |
|
"white" | "w" | [1 1 1] |
|


出力引数
ヒント
plotm 関数に 2 つのポイントを渡すと、関数は地図投影やポイント間の距離に関係なく、各ポイントの位置をマップ上に投影し、それらを結ぶ直線を表示します。2 点間の投影された測地線または等角線曲線を表示するには、まず track2 関数を使用して中間点を挿入します。
バージョン履歴
R2006a より前に導入