メインコンテンツ

estimateBoardCornersLidar

Estimate corners of calibration board in lidar frame

Since R2026a. Replaces detectRectangularPlanePoints.

Description

cornersLidar = estimateBoardCornersLidar(ptCloud,clusterThreshold,boardSize) estimates the 3-D corners of the calibration board in the lidar frame using the input point cloud ptCloud, a clustering distance threshold clusterThreshold, and the board size boardSize.

example

cornersLidar = estimateBoardCornersLidar(ptCloud,clusterLabels,boardSize) estimates the 3-D corners of the calibration board in the lidar frame using the input point cloud, cluster labels clusterLabels, and the board size.

[cornersLidar,boardPtCloud] = estimateBoardCornersLidar(___) additionally returns the detected calibration boards as point clouds.

[___] = estimateBoardCornersLidar(___,Name=Value) specifies options using one or more name-value arguments in addition to any combination of arguments from previous syntaxes. For example, PlaneFitDistance=0.05, sets the maximum distance to fit a plane to each cluster to 0.05.

Examples

collapse all

Load point cloud data from a PCD-format file.

ptCloudFile = fullfile(toolboxdir("lidar"),"lidardata","calibration","pointClouds","01.pcd");
ptCloud = pcread(ptCloudFile);

Visualize the point cloud.

figure
pcshow(ptCloud)

Figure contains an axes object. The axes object contains an object of type scatter.

Remove the ground from the point cloud.

[~,ptCloudNoGround] = segmentGroundSMRF(ptCloud,MaxWindowRadius=8,ElevationThreshold=0.2);

Detect the calibration board in the point cloud and estimate the board corners in the lidar frame.

clusterThreshold = 0.05;
boardSize = [800 1000];
[cornersLidar,boardPtCloud] = estimateBoardCornersLidar(ptCloudNoGround,clusterThreshold,boardSize);

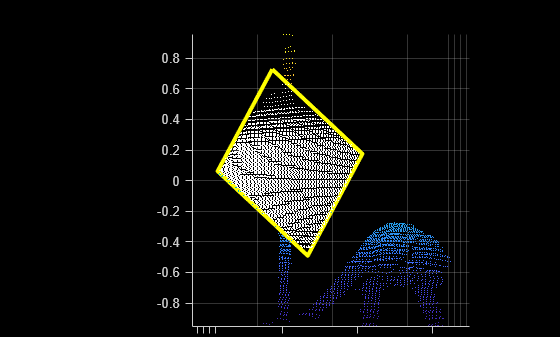
Visualize the detected calibration board in the point cloud.

figure
ax = pcshow(ptCloudNoGround);
hold on
pcshow(boardPtCloud.Location,"white",Projection="orthographic")
cornerIdx = [1 2 3 4 1];
board = plot3(cornersLidar(cornerIdx,1),cornersLidar(cornerIdx,2),cornersLidar(cornerIdx,3),Color="yellow",LineWidth=3);
ax.CameraPosition = [0 0 0];
camlookat(board)

Figure contains an axes object. The axes object contains 3 objects of type scatter, line.

Read point cloud data from a PCD file.

ptCloudFile = fullfile(toolboxdir("lidar"),"lidardata","calibration","pointClouds","02.pcd");
ptCloud = pcread(ptCloudFile);

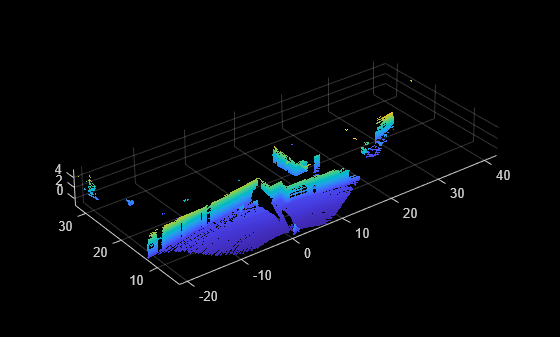
Visualize the point cloud data.

figure
pcshow(ptCloud)

Figure contains an axes object. The axes object contains an object of type scatter.

Select a region of interest to speed up the detection.

radius = 10;
idx = findPointsInCylinder(ptCloud,radius);
ptCloud = select(ptCloud,idx);

Remove the ground from the point cloud.

[~,ptCloudNoGround] = segmentGroundSMRF(ptCloud,MaxWindowRadius=8,ElevationThreshold=0.2);

Cluster the point cloud.

clusterThreshold = 0.05;
minPoints = 50;
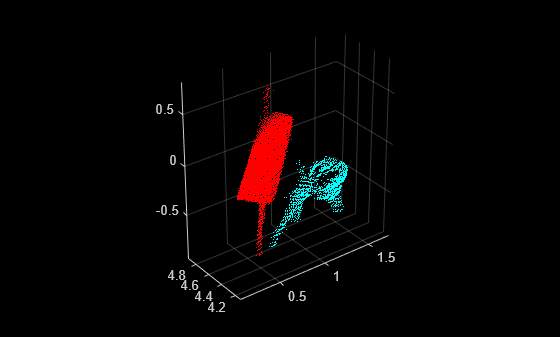
[clusterLabels,numClusters] = pcsegdist(ptCloudNoGround,clusterThreshold,Method="exhaustive",NumClusterPoints=minPoints);

Visualize the clustered point cloud.

idxValidPoints = find(clusterLabels);
labelColorIdx = clusterLabels(idxValidPoints);
segmentedPtCloud = select(ptCloudNoGround,idxValidPoints);
figure
colormap(hsv(numClusters))
pcshow(segmentedPtCloud.Location,labelColorIdx)

Figure contains an axes object. The axes object contains an object of type scatter.

Detect the calibration board in the point cloud.

boardSize = [800 1000];
[cornersLidar,boardPtCloud] = estimateBoardCornersLidar(ptCloudNoGround,clusterLabels,boardSize);

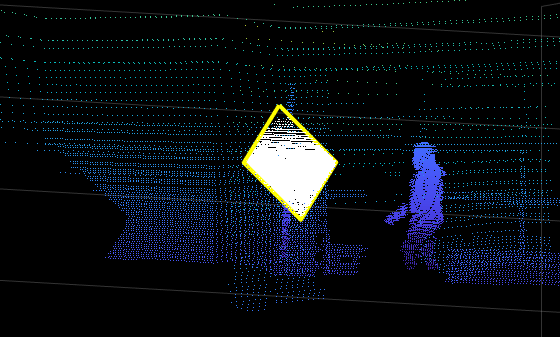
Visualize the detected calibration board.

figure
ax = pcshow(ptCloudNoGround);
hold on
pcshow(boardPtCloud.Location,"white",Projection="orthographic")
cornerIdx = [1 2 3 4 1];
board = plot3(cornersLidar(cornerIdx,1),cornersLidar(cornerIdx,2),cornersLidar(cornerIdx,3),Color="yellow",LineWidth=3);
ax.CameraPosition = [0 0 0];
camlookat(board)

Figure contains an axes object. The axes object contains 3 objects of type scatter, line.

Input Arguments

collapse all

Point cloud, specified as a pointCloud object or an array of pointCloud objects.

Cluster distance threshold to segment each point cloud into clusters, specified as a positive scalar. The function first clusters the point cloud using the cluster threshold as the minimum Euclidean distance between points from different clusters, and then processes each cluster to detect the board. To use a different clustering algorithm or to visualize the clustering results before board detection, use the clusterLabels input instead.

Cluster labels, specified as a cell array of M-element vectors or a cell array of M-by-N matrices. The number of elements in the array must correspond to the number of point clouds in ptCloud.

  • For unorganized point clouds — Each cell contains a vector of length M, where M is the number of points in the point cloud and each of its values is the cluster label that corresponds to each point in the point cloud, with location M-by-3.

  • For organized point clouds — Each cell contains an M-by-N matrix where each of its values correspond to a label for each point in the point cloud with location of size M-by-N-by-3.

Size of calibration board in millimeters, specified as a 2-element vector of the form [sizeDim1 sizeDim2].

Name-Value Arguments

collapse all

Specify optional pairs of arguments as Name1=Value1,...,NameN=ValueN, where Name is the argument name and Value is the corresponding value. Name-value arguments must appear after other arguments, but the order of the pairs does not matter.

Example: PlaneFitDistance=0.05, sets the maximum distance to fit a plane to each cluster to 0.05.

Size tolerance of detected board, specified as a positive scalar in the range [0 1]. The function returns the detected board if its size is within the expected size with respect to the specified tolerance. Specifically, the size of the returned board must be in the range, boardSize +/- boardSize*Tolerance.

Maximum distance to fit a plane to each cluster for board detection, specified as a positive scalar. Decrease this value when working with noisy data to obtain more detections by removing outliers.

Output Arguments

collapse all

Estimated board corners in lidar frame, returned as a 4-by-3-by-N matrix, where N is the number of point clouds. For each point cloud, the corresponding 4-by-3 matrix contains the location (x,y,z) coordinates of the four board corners. If detection fails for a point cloud, the corresponding matrix contains NaN values. Some point clouds may have missing points near the corners of the board. However, this does not affect the calibration workflow, as the corner positions are estimated using the point cloud data that is available.

Point cloud of the calibration board, returned as an array or a pointCloud object. boardPtCloud is of the same size as the input ptCloud. For example, if the input ptCloud is an array with N elements, then boardPtCloud is also an array with N elements.

Version History

Introduced in R2026a

expand all