LiDAR とカメラのキャリブレーションおよび融合
この例では、LiDAR センサーとカメラの間の剛体変換を推定する方法と、キャリブレーション結果を使用して LiDAR センサーの点群データとカメラのイメージ データを融合する方法を示します。
概要
LiDAR センサーとカメラは、補完的な情報を提供するため、しばしば併用されます。LiDAR センサーは 3 次元の空間データを取得するのに対し、カメラは外観やテクスチャに関してより多くの情報を含むイメージを取得します。両方のセンサーのデータを融合することで、オブジェクト検出および分類のワークフローを強化できます。LiDAR カメラ キャリブレーションは、カメラに対する LiDAR センサーの相対的な回転と並進を表す変換行列を推定します。この変換は、LiDAR とカメラのデータの融合に使用できます。
次の図は、LiDAR カメラ キャリブレーションのワークフローを示しています。このプロセスは、チェッカーボード、ChArUco ボード、または AprilGrid などのキャリブレーション ボードを使用し、ボードが点群とイメージの両方に写っている複数のフレームを取得することから始まります。次に、点群とイメージの両方でキャリブレーション ボードを検出し、LiDAR 座標系とカメラ座標系でボードのコーナーを推定します。図の左側は、LiDAR 座標系において検出されたキャリブレーション ボードを含む点群を示し、図の右側は、カメラ フレームにおいて検出されたキャリブレーション ボードを示しています。キャリブレーションは、LiDAR 座標系におけるボードのコーナーをカメラ座標系におけるボードのコーナーに整合させる剛体変換を出力します。これは、rigidtform3dオブジェクトとして表されます。LiDAR カメラ キャリブレーションの詳細については、LiDAR カメラ キャリブレーションとはを参照してください。

この例では、Ouster OS1 LiDAR センサーで収集した、同期された PNG イメージと PCD 点群のペアを使用します。ここでは、カメラの内部パラメーターが既に推定済みであることを前提としています。カメラの内部パラメーターの計算の詳細については、単一カメラのキャリブレーションの精度の評価を参照してください。
キャリブレーション データの読み込み
イメージと点群データをワークスペースに読み込みます。
imageDataPath = fullfile(toolboxdir("lidar"),"lidardata","calibration","images");
imds = imageDatastore(imageDataPath);
imageFileNames = imds.Files;

ptCloudFilePath = fullfile(toolboxdir("lidar"),"lidardata","calibration","pointClouds");
pcds = fileDatastore(ptCloudFilePath,ReadFcn=@pcread);
ptCloudFileNames = pcds.Files;
カメラの内部パラメーターをワークスペースに読み込みます。
cameraIntrinsicFile = fullfile(imageDataPath,"intrinsics.mat");
intrinsics = load(cameraIntrinsicFile).intrinsics;
イメージ内のボード コーナーの検出
対称なボードの使用に関する警告を無効にします。対称なボードは推奨されませんが、均一なパディングと限定的なボードの回転 (収集されたイメージでは 45 度未満) によって、対称性が結果に影響を与えないようにします。
currentState = warning;
warning("off","vision:calibrate:boardShouldBeAsymmetric")
チェッカーボードの点を検出します。
[imagePoints,patternDims] = detectCheckerboardPoints(imageFileNames,PartialDetections=false);
元の警告状態に戻します。
warning(currentState)
次の図に従ってチェッカーボードのパラメーターを指定します。
正方形のサイズをミリメートル単位で指定します。
squareSize = 100;
パディング [P1 P2 P3 P4] をミリメートル単位で指定します。
padding = [100 100 100 100];
ボード コーナーをカメラ座標系で推定します。
[cornersCamera,boardSize] = estimateBoardCornersCamera("checkerboard",imagePoints,...
    intrinsics,patternDims,squareSize,Padding=padding);
検出されたすべてのボードをカメラ フレームで可視化します。
figure
cam = plotCamera(Size=0.25,Opacity=0.8);
hold on

numImages = numel(imageFileNames);
plotColors = hsv(numImages);
cornerIdx = [1 2 3 4 1];
for i = 1:numImages
    plot3(cornersCamera(cornerIdx,1,i),cornersCamera(cornerIdx,2,i),cornersCamera(cornerIdx,3,i),Color=plotColors(i,:),LineWidth=2)
end
set(gca,CameraUpVector=[-1 0 0]);

点群におけるボード コーナーの検出
まず関心領域を選択して検出を高速化し、その後に地面の点を削除することで、点群を前処理します。
roi = [-5 5 -Inf Inf -Inf Inf];

numPtClouds = numel(ptCloudFileNames);
ptCloudArr = repmat(pointCloud(zeros(0,3)),numPtClouds,1);

for i = 1:numPtClouds
    ptCloud = pcread(ptCloudFileNames{i});

    idx = findPointsInROI(ptCloud,roi);
    ptCloud = select(ptCloud,idx);

    [~,ptCloud] = segmentGroundSMRF(ptCloud,MaxWindowRadius=8,ElevationThreshold=0.2,ElevationScale=1.25);

    ptCloudArr(i) = ptCloud;
end
ボード検出のために、各点群をクラスタリングするためのクラスターしきい値を指定します。
clusterThreshold = 0.05;
ボード検出のために、各点群クラスターに平面を当てはめる際に使用する平面の当てはめ距離を指定します。
planeFitDistance = 0.05;
ボード コーナーを LiDAR フレームで推定します。
[cornersLidar,ptCloudBoard] = estimateBoardCornersLidar(ptCloudArr,clusterThreshold,boardSize,...
    PlaneFitDistance=planeFitDistance);
検出されたすべてのキャリブレーション ボードを LiDAR フレームで可視化します。
figure
allPtClouds = pccat(ptCloudArr);
pcshow(allPtClouds)
hold on

for i = 1:numPtClouds
    pcshow(ptCloudBoard(i).Location,"white",ViewPlane="XZ")
    plot3(cornersLidar(cornerIdx,1,i),cornersLidar(cornerIdx,2,i),cornersLidar(cornerIdx,3,i),Color=plotColors(i,:),LineWidth=2)
end

LiDAR センサーからカメラへの変換の特定
[lidarCameraTform,errors] = estimateLidarCameraTransform(ptCloudBoard,...
    cornersCamera,intrinsics,Lidar3DCorners=cornersLidar);
キャリブレーション結果を使用して LiDAR フレームとカメラ フレームを整合させた後、キャリブレーション ボードを可視化します。
figure
allPtCloudTransformed = pctransform(allPtClouds,lidarCameraTform);
pcshow(allPtCloudTransformed)
hold on
plotCamera(Size=0.25,Opacity=0.8)

for i = 1:numPtClouds
    ptCloudBoardTransformed = pctransform(ptCloudBoard(i),lidarCameraTform);
    pcshow(ptCloudBoardTransformed.Location,"white",ViewPlane="YX")
    cornersLidarTransformed = transformPointsForward(lidarCameraTform,cornersLidar(:,:,i));
    plot3(cornersLidarTransformed(cornerIdx,1),cornersLidarTransformed(cornerIdx,2),cornersLidarTransformed(cornerIdx,3),Color=plotColors(i,:),LineWidth=2)
    plot3(cornersCamera(cornerIdx,1,i),cornersCamera(cornerIdx,2,i),cornersCamera(cornerIdx,3,i),Color=plotColors(i,:),LineWidth=2)
end
title("Alignment after calibration")

あるいは、各イメージにおけるボードの整合を次のように可視化することもできます。
最初のイメージを読み込み、歪み補正します。
idxDataPair = 1;
I = imread(imageFileNames{idxDataPair});
J = undistortImage(I,intrinsics);
カメラと LiDAR からイメージにボード コーナーを投影します。
projectedCornersCamera = projectLidarPointsOnImage(cornersCamera(:,:,idxDataPair),intrinsics,rigidtform3d);
projectedCornersLidar = projectLidarPointsOnImage(cornersLidar(:,:,idxDataPair),intrinsics,lidarCameraTform);
投影されたボードをイメージ上に可視化します。カメラからのボードを赤で、LiDAR センサーからのボードを黄色でプロットします。
figure
imshow(J)
hold on
showShape("polygon",projectedCornersCamera,Color="red")
showShape("polygon",projectedCornersLidar,Color="yellow")

キャリブレーション誤差の可視化と評価
次の誤差メトリクスを使用して、キャリブレーションの精度を推定できます。
"並進誤差" は、点群内のキャリブレーション ボードのコーナーの重心座標と、対応するイメージ内のそれらの重心座標との差 (メートル単位) です。
"回転誤差" は、点群内のキャリブレーション ボードで定義される法線角度と、対応するイメージ内のそれらの法線角度との差 (度単位) です。
"再投影誤差" は、点群からイメージに投影された (変換された) キャリブレーション ボードのコーナーの重心座標と、対応するイメージ内のそれらの重心座標との差 (ピクセル単位) です。
データ ペアごとの並進誤差をプロットします。
figure
bar(errors.TranslationError)
title("Translation Error")
xlabel("Data Pair")
ylabel("Error (meters)")

データ ペアごとの回転誤差をプロットします。
figure
bar(errors.RotationError)
title("Rotation Error")
xlabel("Data Pair")
ylabel("Error (degrees)")

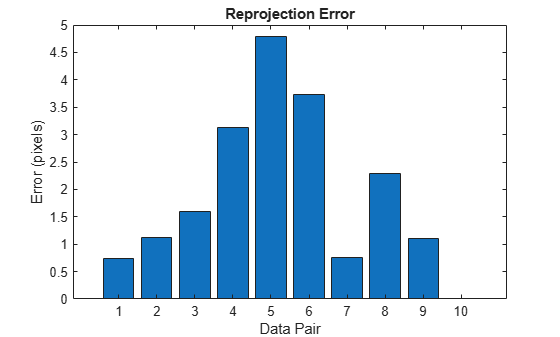
データ ペアごとの再投影誤差をプロットします。
figure
bar(errors.ReprojectionError)
title("Reprojection Error")
xlabel("Data Pair")
ylabel("Error (pixels)")
誤差メトリクスに基づいて、キャリブレーションから一部のデータ ペアを除外し、結果の精度を向上させるかどうかを選択できます。たとえば、次のように、再投影誤差が最も大きいデータ ペアを除外できます。
再投影誤差が最も大きいデータ ペアを特定します。
[~,idxToExclude] = max(errors.ReprojectionError);
除外するデータ ペアの値を削除します。
cornersCamera(:,:,idxToExclude) = NaN;
cornersLidar(:,:,idxToExclude) = NaN;
キャリブレーションを繰り返します。
[lidarCameraTform,errors] = estimateLidarCameraTransform(ptCloudBoard,...
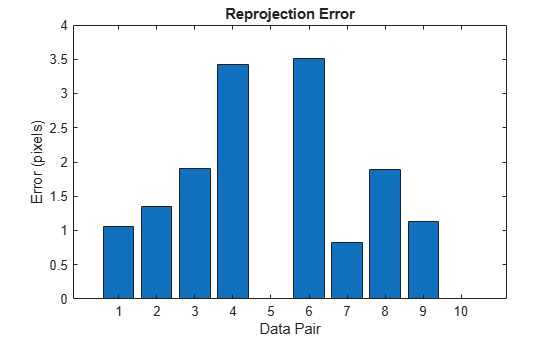
cornersCamera,intrinsics,Lidar3DCorners=cornersLidar);選択したデータ ペアを除外した後の再投影誤差をプロットします。
figure
bar(errors.ReprojectionError)
title("Reprojection Error")
xlabel("Data Pair")
ylabel("Error (pixels)")
LiDAR とカメラのデータの融合
LiDAR カメラ キャリブレーションの結果を調整した後、センサー間の変換を使用して点群に色情報を追加できます。例のこのセクションでは、MultiSensorDrivingData_Seg7_Seq30 データを使用します。このデータには、前のセクションでキャリブレーションに使用したものと同じセンサー構成で収集された LiDAR とカメラのデータが含まれています。データセットは約 1.8 GB であることに注意してください。
データを struct としてダウンロードするには、helperDownloadDataset サポート関数を使用します。
if ~exist('recordedData','var')
    recordedData = helperDownloadDataset();
end
LiDAR カメラ キャリブレーションにより、LiDAR フレームをカメラ フレームに整合させる変換が得られます。点群に色情報を追加するには、この変換の逆、すなわちカメラ フレームを LiDAR フレームに整合させる変換が必要です。
cameraLidarTform = invert(lidarCameraTform);
次に、利用可能な各データ ペアについて、次の手順を繰り返します。
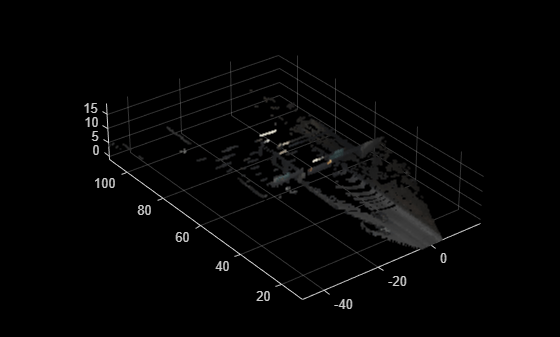
1) 点群フレームを取得します。
numFrame = 1;
ptCloud = recordedData.Lidar.PointClouds{numFrame};
figure
pcshow(ptCloud)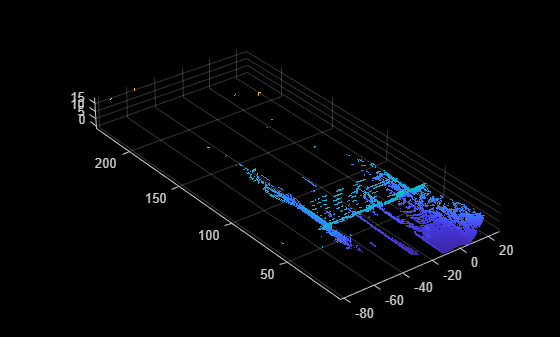
2) タイムスタンプを使用して、点群に対応するイメージを特定します。
cameraTimestamps = recordedData.Camera.Timestamps;
ptCloudTimestamp = recordedData.Lidar.Timestamps(numFrame);
[~,idxImage] = min(abs(cameraTimestamps - ptCloudTimestamp));
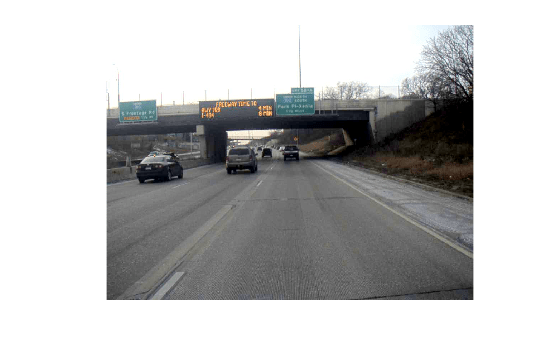
3) 対応するイメージ フレームを取得します。
I = recordedData.Camera.Images{idxImage};
figure
imshow(I)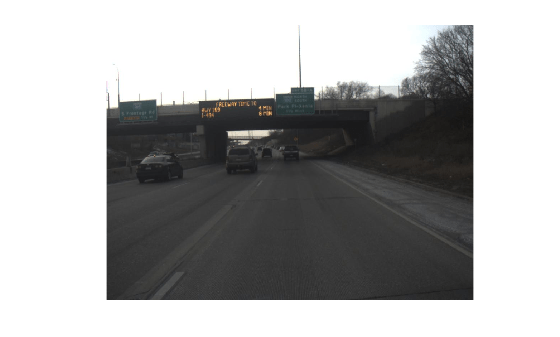
4) imlocalbrighten関数を使用して、イメージの明るさを強調します。
Ienhanced = imlocalbrighten(I);
figure
imshow(Ienhanced)
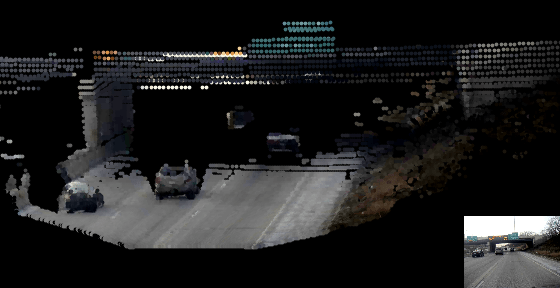
5) fuseCameraToLidar関数を使用して、点群に色情報を追加します。
ptCloudColor = fuseCameraToLidar(I,ptCloud,intrinsics,cameraLidarTform);
figure
pcshow(ptCloudColor,MarkerSize=20)
ylim([10 110])
残りのフレームに対して手順 1 ~ 5 を繰り返します。結果を可視化するには、pcplayerを使用し、右下隅に座標軸を追加することでイメージを同時に可視化できます。
点群の可視化のために pcplayer を設定します。
% Close existing plots and clear player from previous runs.
close all
if exist("player","var")
    clear player
end
figure(WindowState="maximized")
axPtCloud = axes;
player = pcplayer([-60 60],[0 150],[-5 30],Parent=axPtCloud,MarkerSize=75,AxesVisibility="off");
可視化を改善するためにカメラ位置とビューを変更します。
axPtCloud.CameraPosition = [12 -105 5];
axPtCloud.CameraTarget = [-2 88 2];
axPtCloud.CameraUpVector = [0 0 1];
axPtCloud.CameraViewAngle = 5;
イメージを可視化するためにインセット座標軸を作成します。
axImage = axes('Position',[0.79 0 0.25 0.25]);
box on;
すべての点群に対して手順 1 ~ 5 を繰り返します。
numPtClouds = numel(recordedData.Lidar.PointClouds);

for i = 1:numPtClouds
    % Get point cloud and its corresponding timestamp
    ptCloud = recordedData.Lidar.PointClouds{i};
    ptCloudTimestamp = recordedData.Lidar.Timestamps(i);

    % Find the image that corresponds to the point cloud based on
    % timestamps
    [~,index] = min(abs(cameraTimestamps - ptCloudTimestamp));
    I = recordedData.Camera.Images{index};

    % Enhance the color of the image
    I = imlocalbrighten(I);

    % Display the image
    imshow(I,Parent=axImage)

    % Add color information to the point cloud
    ptCloudColor = fuseCameraToLidar(I,ptCloud,intrinsics,cameraLidarTform);

    % Display the point cloud
    view(player,ptCloudColor);
end
close(axPtCloud.Parent)
参考文献
[1] Zhou, Lipu, Zimo Li, and Michael Kaess. "Automatic Extrinsic Calibration of a Camera and a 3D LiDAR Using Line and Plane Correspondences." In 2018 IEEE/RSJ International Conference on Intelligent Robots and Systems (IROS), 5562–69. Madrid: IEEE, 2018. https://doi.org/10.1109/IROS.2018.8593660.
[2] Arun, K. S., T. S. Huang, and S. D. Blostein. "Least-Squares Fitting of Two 3-D Point Sets." IEEE Transactions on Pattern Analysis and Machine Intelligence PAMI-9, no. 5 (September 1987): 698–700. https://doi.org/10.1109/TPAMI.1987.4767965.