plotsomhits
(削除予定) 自己組織化マップ サンプル ヒットのプロット
plotsomhits は将来のリリースで削除される予定です。詳細については、Transition Legacy Neural Network Code to dlnetwork Workflowsを参照してください。
コードの更新に関するアドバイスについては、バージョン履歴を参照してください。
構文
plotsomhits(net,inputs)
説明
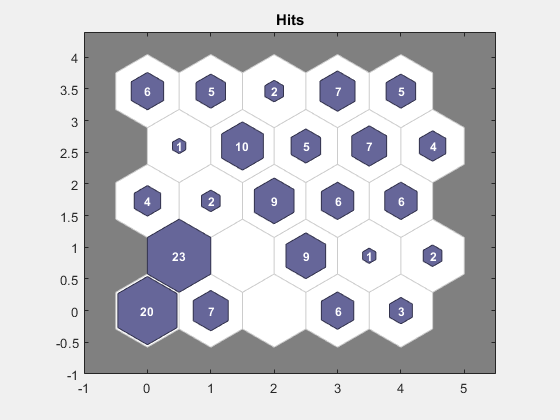
plotsomhits(net,inputs) は SOM 層をプロットし、それらが分類する入力ベクトルの数を各ニューロンで示します。各ニューロンにおけるベクトルの相対数は、色付きのパッチのサイズで示されます。
このプロットは、トポロジが hextop および gridtop である SOM ネットワークをサポートしますが、トポロジが tritop または randtop である場合はサポートしません。
例
SOM サンプル ヒットのプロット
x = iris_dataset;
net = selforgmap([5 5]);
net = train(net,x);
plotsomhits(net,x)