MATLAB での Bug Finder 解析結果の可視化
Polyspace® 解析の後、結果を MATLAB® table に読み取ることができます。この table を使用して、結果に関するグラフや統計を生成できます。MATLAB Report Generator™ をお持ちの場合は、PDF レポートまたは HTML レポートにこれらの table やグラフを含めることができます。
結果を MATLAB table にエクスポート
既存の Polyspace 解析結果を MATLAB table に読み取るには、解析結果に関連付けられた polyspace.BugFinderResults オブジェクトを使用します。
たとえば、MATLAB インストール フォルダーの読み取り専用サブフォルダー polyspace/examples/cxx/Bug_Finder_Example/Module_1/BF_Result に含まれるデモの結果を読み取るには、結果を書き込み可能なフォルダーにコピーして読み取ります。
resPath = fullfile(polyspaceroot, 'polyspace', ...
    'examples', 'cxx', 'Bug_Finder_Example', 'Module_1','BF_Result');

userResPath = tempname;
copyfile(resPath,userResPath);

resObj = polyspace.BugFinderResults(userResPath);
resSummary = getSummary(resObj);
resTable = getResults(resObj);
resSummary と resTable は、Polyspace の結果の概要と詳細を含む 2 つの MATLAB table です。あるいは、polyspace.Project (Polyspace Code Prover) オブジェクトを使用して C/C++ ソース ファイルに Polyspace 解析を実行できます。解析後、オブジェクトの Results プロパティに結果が含まれます。MATLAB スクリプトを使用した Polyspace 解析の実行を参照してください。
結果からグラフを生成してレポートに含める
結果を MATLAB table に読み取ったら、その結果を便利な形式に可視化できます。MATLAB Report Generator をお持ちの場合は、可視化を含む PDF レポートまたは HTML レポートを作成できます。
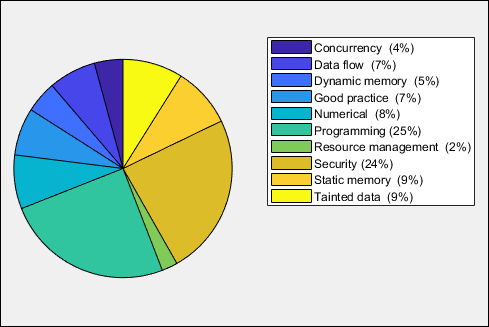
この例では、欠陥グループごとに欠陥の分布を示す円グラフを作成し、そのグラフをレポートに含めます。
%% This example shows how to create a pie chart from your
% results and append it to a report.

%% Generate Pie Chart from Polyspace Results

% Copy a demo result set to a temporary folder.
resPath = fullfile(polyspaceroot,'polyspace','examples','cxx', ...
  'Bug_Finder_Example','Module_1','BF_Result');
userResPath = tempname;
copyfile(resPath,userResPath);

% Read results into a table.
resObj = polyspace.BugFinderResults(userResPath);
resTable = getResults(resObj);

% Eliminate results that are not defects.
matches = (resTable.Family == 'Defect');
defectTable = resTable(matches ,:);

% Create a pie chart showing distribution of defects.
defectGroupList = removecats(defectTable.Group);
pieDefects = pie(defectGroupList);
labels = get(pieDefects(2:2:end),'String');
set(pieDefects(2:2:end),'String','');
legend(labels,'Location','bestoutside')

% Save the pie chart.
print('file','-dpng');


%% Append Pie Chart to Report
% Requires MATLAB Report Generator

% Create a report object.
import mlreportgen.dom.*;
report = Document('PolyspaceReport','html');

% Add a heading and paragraph to the report.
append(report, Heading(1,'Bug Finder Defect Distribution Graph'));
paragraphText = ['The following graph shows the distribution of ' ...
               'defects in your code.'];
append(report, Paragraph(paragraphText));

% Add the image to the report.
chartObj = Image('file.png');
append(report, chartObj);

% Add another heading and paragraph to the report.
append(report, Heading(1,'Defect Details'));
paragraphText = ['The following table shows the defects ' ...
               'in your code.'];
append(report, Paragraph(paragraphText));

% Add the table of defects to the report.
reducedInfoTable = defectTable(:,{'File','Function','Check',...
    'Status','Severity','Comment'});
reducedInfoTable = sortrows(reducedInfoTable,[1 2]);
tableObj = MATLABTable(reducedInfoTable);
tableObj.Style = {Border('solid','black'),ColSep('solid','black'),...
    RowSep('solid','black')};
append(report, tableObj);

% Close and view the report in a browser.
close(report);
rptview(report.OutputPath);
polyspace.BugFinderResults:Bug Finder の結果を table に読み取る。pie:categorical 配列から円グラフを作成。代わりに、関数histogramまたはheatmapを使用することもできます。ヒストグラムを作成するには、スクリプト内の
pieをhistogramに置き換え、円グラフの凡例を削除します。mlreportgen.dom.Document(MATLAB Report Generator):レポート形式とレポートの格納場所を指定するレポート オブジェクトを作成。append(MATLAB Report Generator):既存のレポートにコンテンツを追加。
このスクリプトを実行すると、欠陥グループ別に欠陥の分布が表示されます。このスクリプトでは、Polyspace の欠陥のグラフと table を含む HTML レポートも作成します。
レポート作成前に、任意の基準を使用して、結果テーブルから行を削除できます。前述の例では、結果は欠陥ファミリに属していなければならないという基準を使用しています。Bug Finder の結果ファミリも参照してください。
matches = (resTable.Family == 'Defect');
defectTable = resTable(matches ,:);
代わりに、別の基準を使用することができます。たとえば、ヘッダー ファイルの結果を削除して、ソース ファイルの結果のみを保持できます。
sourceExtensions = [".c",".cpp",".cxx"];
fileNameStrings = string(resTable.File);
matches = endsWith(fileNameStrings,sourceExtensions);
sourceTable = resTable(matches ,:);